


Introduction
Neuropsychiatric disorders contribute significantly to the overall disease burden both globally and in South Africa (SA). In SA, these disorders rank as the third-highest contributor to disability-adjusted life years (DALYs).1 The South African Stress and Health (SASH) study found a high prevalence of mental health (MH) and substance use disorders in the Western Cape (WC) Province of South Africa, with a 39% lifetime prevalence of any mental disorder.2 This falls above the 31% national lifetime prevalence, and sits in the upper quartile of global lifetime prevalence rates (36─47%) according to a study by the World Health Organization.2,3 Anxiety and substance use disorders are the most common conditions, with lifetime prevalence rates of 19% (SA: 16%; Global IQR: 1 017%) for anxiety disorders, and 21% (SA: 13%; Global IQR: 21─26%) for substance use disorders.2,3 Psychotic disorders and bipolar disorders are less common in Africa, with lifetime prevalence estimates ranging from 1% to 4%.4 A high prevalence of chronic physical disease, along with several social determinants such as food insecurity, poverty, and substance abuse, as well as frequent experiences of violence and trauma, are known drivers of the substantial burden of MH conditions in SA.5–7
Consistent with global trends, the WC observed a high and growing prevalence and burden of MH conditions prior to the COVID-19 pandemic in 2019.8 The containment measures to prevent the spread of COVID-19 had a large and lasting impact on the physical, mental, and financial lives of the population of the country, as well as on the South African healthcare system.9 Additionally, the diversion of healthcare resources to services associated with COVID-19 had a negative impact on access to care required by patients with severe MH conditions.10 These factors served to further increase the burden of MH conditions while decreasing the healthcare system’s ability to provide adequate care for patients.
Although most patients with MH conditions do not require in-patient care, expenditure on in-patient care accounted for 86% of the total MH expenditure in the public health services in SA, with specialised psychiatric hospital admissions alone requiring 46% of the total MH expenditure. Of the patients admitted to hospital, nearly one in four were re-admitted within three months of discharge, with re-admissions accounting for 18% of total MH expenditure in SA.11 In the context of an increasingly financially constrained environment in South Africa’s public healthcare system, it is becoming ever more important to understand the factors which influence these re-admissions and how they can be reduced.12
The equitable and strategic allocation of resources is reliant on the availability of relevant and reliable monitoring surveillance mechanisms. The practice described in this paper aligns primarily with Objective 3 of the 2023─2030 National Mental Health Policy Framework and Strategic Plan: “To conduct mental health surveillance and research and strengthen innovation”,13 by utilising available electronic health records (EHR) to develop a dashboard for monitoring MH-related admissions in the WC. Aimed at facility managers and MH stakeholders, this dashboard facilitates contextual awareness of MH admission trends when identifying areas of need. Additionally, the dashboard is designed to inform policy and resource allocation optimally, and assess capacity shortfalls when addressing Objectives 1 and 2 of the 2023–2030 National Mental Health Policy Framework and Strategic Plan, “To strengthen District and Primary Health Care based mental health services” and “To build Institutional Capacity”.13
Case description
Setting
The Western Cape Province has an estimated population of 7.2 million individuals, 74.9% of whom are reliant on health services from the public sector.14 The adult population is serviced by 33 district hospitals, four regional hospitals and two central hospitals (which are grouped together as ‘district/acute hospitals’ for this analysis), all of which refer patients to the three specialised psychiatric hospitals of Lentegeur, Stikland, and Valkenberg. In the country’s public sector, the treatment gap for in-patient services is high at 89%, with only 0.31 psychiatrists and 0.97 psychologists available per 100 000 population.12,15
Data sources
The Provincial Health Data Centre (PHDC) collates all available patient-level electronic health data captured into routine health information systems within public health facilities in the WC.16 This includes: admissions to psychiatric wards, derived from Clinicom ─ a patient administration database used at all public hospitals in the province ─ as well as an electronic continuity of care record (eCCR), an electronic discharge summary that includes information on discharge diagnoses using ICD-10 coding. Over the past 25 years, the Western Cape Department of Health and Wellness (WCDoHW) has gradually implemented patient administration systems, such as Clinicom and eCCR, which share a unique health identifier referred to as the patient master index (PMI) for patients interacting with the system. Data received from these source systems are consolidated in the PHDC environment by mapping each data point to a person within the PMI, facility or location, and standard ontology such as ICD-10 codes for diagnoses or ATC codes for medication. Using this unique patient identifier in the PMI, admissions are linked to the patient’s interactions with the provincial health system at hospital and primary care levels prior to admission and following discharge.12
Study population and inclusion/exclusion criteria
The cohort of patients in this analysis includes all individuals with a psychiatric hospital admission in a public health facility in the WC, beginning at any point between 1 January 2015 and 31 December 2023. Psychiatric admissions were identified through admission to one of the three specialised psychiatric facilities, or an admission to any other public hospital in the province, with an admitting speciality indicating ‘Psychiatry’, as ICD-10 diagnostic coding was not always reliably captured. As such, patients with psychiatric conditions admitted to other specialties or seen only in Emergency Centres were not included in the cohort. The cohort is defined around each patient admission, rather than a facility record, as a single admission may span several facilities when patients are referred on for care.
Data-sharing environment for outputs
At the PHDC, a web-based electronic health record portal called Single-Patient-Viewer (SPV) has been developed. The tool is intended to assist clinicians and public healthcare management stakeholders in information discovery by integrating clinical data into tabular or graphical views.12 By making the dashboard available on SPV, the MH stakeholders for which the dashboard is intended have an effective means of accessing the tool in a manner that ensures data security.
Method
Development framework
The development and integration of the Mental Health Admissions Dashboard into the PHDC system follows steps described in the CeHRes (Centre for eHealth Research) Roadmap for eHealth development.17 This process consists of five intertwined phases:
-
Contextual inquiry: entails information gathering to contextualise the tool for the environment it aims to serve and identify problems in the environment that it may address.
-
Value specification: entails the recognition and quantification of the economic, medical, social, and behavioural values users and stakeholders determined as being relevant to the identified problems. These values are used to establish and define requirements for the digital tool.
-
Design: entails the development of prototypes for a tool to meet the values and user requirements from the previous phases.
-
Implementation/operationalisation: concerns the introduction, adoption, and employment of the developed tool in practice.
-
Evaluation: entails the assessment of the tool’s effectiveness, performance, and impact. This allows for iterative improvements and changes to be made to the current implementation.
Although every phase of this framework forms an essential part of the development process, the primary focus of this paper is to describe and outline the steps used in the design phase for the development of the Mental Health Admissions Dashboard. However, the other phases of the framework are described to contextualise and inform the design process.
Gathering requirements
An important step before beginning any technical work on the development of the proposed dashboard involves convening a multidisciplinary team of key stakeholders engaged with the provision of MH services in the province. This team should include a variety of clinicians, MH specialists, district and sub-structure health directors, district and specialist facility managers, as well as the data management team. The team begins the process to inform the development of the dashboard through the contextual inquiry and value specification phases of the CeHRes Roadmap by identifying problems with MH surveillance from each of their perspectives in order to contextualise areas of need. The primary objective for this team is to determine how best to leverage available EHRs to improve the MH service provision in the province by identifying the key surveillance metrics of interest to the various stakeholders. These identified metrics are then assessed for feasibility under data limitations and used to establish baseline specifications for the dashboard’s development. Psychiatric admissions relating to the treatment of substance abuse and self-harm were identified as areas of interest.
Assembly of the dataset underlying the dashboard
Informed by user requirements identified in the contextual inquiry and value specification phases, the design phase begins by taking steps to develop a prototype to meet the user requirements. The primary dataset underlying the dashboard is an admission-level table stored in a SQL (Structured Query Language) relational database, with each row corresponding to a single psychiatric admission. This follows from the relational database environment in which PHDC healthcare data are stored, and follows recommended ETL (extract, transform, load) beneficiation processes.18 The data for each admission are beneficiated with details on patient demographics, comorbidities, and engagements with healthcare services preceding and following admission.
The assembly of this dataset begins by creating a table of admission details for all psychiatric admissions as described in the population and inclusion/exclusion criteria. Each row contains the patient’s unique PMI identification number; location or facility; facility district; facility metro/rural classification; admission and discharge dates and wards; discharge destination; the patient’s primary diagnosis, and the broad primary diagnosis category. The broad diagnosis categories are based on the primary discharge diagnosis ICD-10 coding and are grouped as follows: mood disorders, including both uni- and bipolar depression (F30─F39); schizophrenia and other psychotic disorders (F20─F29); substance-related disorders (F10─F19), and other diagnoses. Indicator variables based on ICD-10 coding are then created for substance-related (F10─F19) and self-harm-related (X60─X85, R45.8) diagnoses to indicate whether any related diagnoses appear on the discharge summary (i.e. not merely the primary diagnosis). Details relating to comorbidities known at the time of admission are then included for the following comorbidities: HIV, tuberculosis, diabetes, hypertension, epilepsy, chronic kidney disease, and ischaemic heart disease. Details include an indicator variable for the presence of each comorbidity; dates for earliest and most recent healthcare interactions relating to the comorbidity, and the date at which treatment for the comorbidity began. The next details to be included are counts of any interactions with outpatient departments that occurred during the admission. These have been limited to interactions with pharmacy, medical consultation, and allied health departments of occupational therapy, social work, and psychology.
Details for admissions that occurred before the admission in question are then included. A distinction is made between admissions at a different facility of patients who were discharged within a day of the admission line in the dataset, a previous psychiatric admission within the year preceding the admission, and a previous admission to a specialist psychiatric facility within the year preceding the admission. Counts of the number of psychiatric admissions and admissions to specialist psychiatric facilities within the year preceding the admission are also included. Admissions that occurred within a day of the admission line in the dataset are assumed to indicate patients who were referred on for hospital care. As such, these admissions are considered to form part of the patient-care journey and are included in length-of-stay (LOS) calculations. Similarly, date and location details regarding Primary Health Care (PHC) visits either within a day of the admission and the most recent PHC visit are included, along with the number of PHC visits the patient had within the year preceding the admission and the number of dispensations of medications for the treatment of MH conditions within the year preceding the admission.
The next details to be included are those relating to the first contact the patient has with the healthcare system within 90 days following discharge. These details include the date of first contact; the location or facility; whether the contact was an admission, a visit to a hospital outpatient department, or a PHC visit; whether the facility type matched what was specified in the admission’s discharge destination, and the number of days until contact was made following discharge from the admission. Similarly, details of the date and location of the next psychiatric admission are included where these are available.
Lastly, patient demographic details such as sex, age, and age category (<18, 18─59, >59) are included in the dataset. These age categories are chosen to allow patients that form part of the child and adolescent and geriatric population sub-groups to be separated from the general psychiatric population, allowing for reporting metrics on these specialised population groups which are often serviced in specialised wards.
Updating and maintaining the dataset
To ensure that the data reflected in the dashboard are accurate and up to date, the dataset on which it is based should be regularly updated and refreshed. To facilitate this, the SQL queries used to produce the dataset are written into a stored procedure with a few additional steps. The first addition is to include a parameter to facilitate the two main use cases of the stored procedure (i.e. rebuild = 1 or 0), namely, to update the dataset with new data, or to recreate the entire dataset. When recreating the dataset, the existing table is truncated and the queries are run for all admissions in the included population. Recreating the entire dataset daily is likely to be computationally intensive, making the use case of updating the existing dataset the logical choice for routine operation. For this scenario, before running the queries to generate the dataset, a table is created that includes all the patient PMI ID values from admissions that have taken place since the dataset was last updated. Any rows referring to these patient PMI IDs in the dataset are then removed, and the queries are run to generate a dataset for all the psychiatric admissions relating to this patient list and the new set of data is appended to the original dataset. This ensures that all new psychiatric admission data are included and any data on previous admissions for these patients are updated to reflect changes in columns for next admissions, first contacts, and admission/PHC visit counts.
The SQL server management studio environment allows for stored procedures to be scheduled, enabling the procedure to be set to run automatically and update the dataset on a regular basis. Additionally, it is good practice to conduct a complete recreation of the full dataset in the medium to long term. When updating the dataset through automated scheduling, it is important to include an alert procedure to notify the dataset’s custodian should any errors occur while running the updating procedures. This ensures that failed updates to the dataset do not go unnoticed. Additionally, before the dataset is linked to the Microsoft PowerBI dashboard, the PMI IDs used to link the admission data to each patient are perturbed to further de-identify the dataset. The dataset used then requires a re-identification key to link the data back to the PMI.
Dataset visualisation and creation of the front-end dashboard
With a comprehensive dataset in place, the next step is developing a front-end dashboard to visualise the data. This is the component that will be shared with MH stakeholders as the end-users of the tool. The creation of comprehensive, informative data visuals and descriptive statistics is the step that provides the greatest data beneficiation by making trends in psychiatric admissions easier to identify and monitor over time. All the dashboard front-end development for this tool was done using Microsoft PowerBI (Version 2.116) after connecting the SQL database table through a secure dataflow with row-level security.
Having an admission-level dataset with descriptive details such as location and patient demographics allows for aggregation flexibility to each grouping of patients, facilities or diagnosis categories. When identifying which groupings would inform aggregation of the data, it is valuable to reflect on who the end-users are and the surveillance metrics relevant to them. In the complex landscape of MH service provision, the number of measures can grow rapidly, overwhelming the user. It is essential to incorporate user design elements that facilitate easy navigation and interpretation of the data during development. This includes grouping pages and measures into related categories, landing, navigation, and description pages, and visuals with descriptive titles and defined axes.
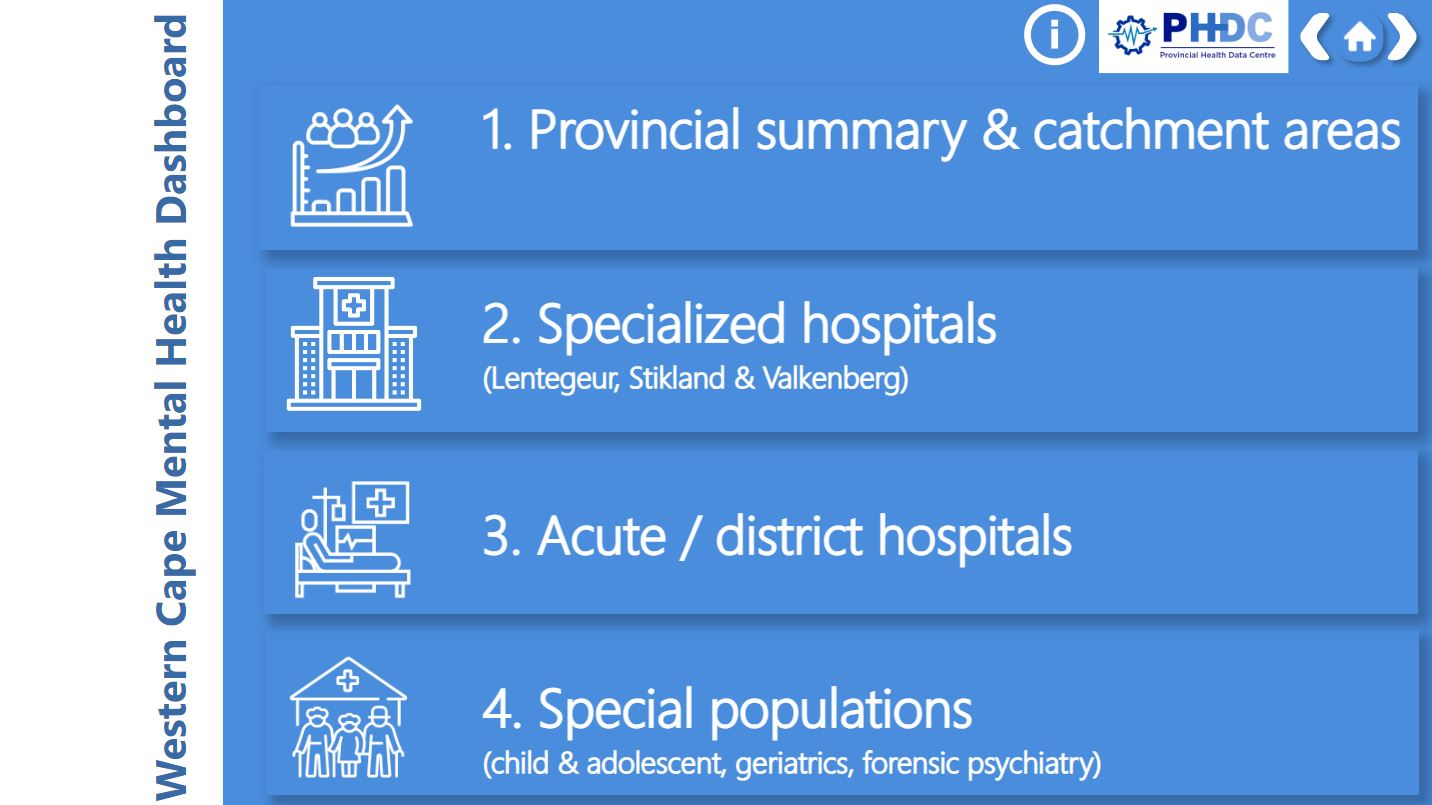
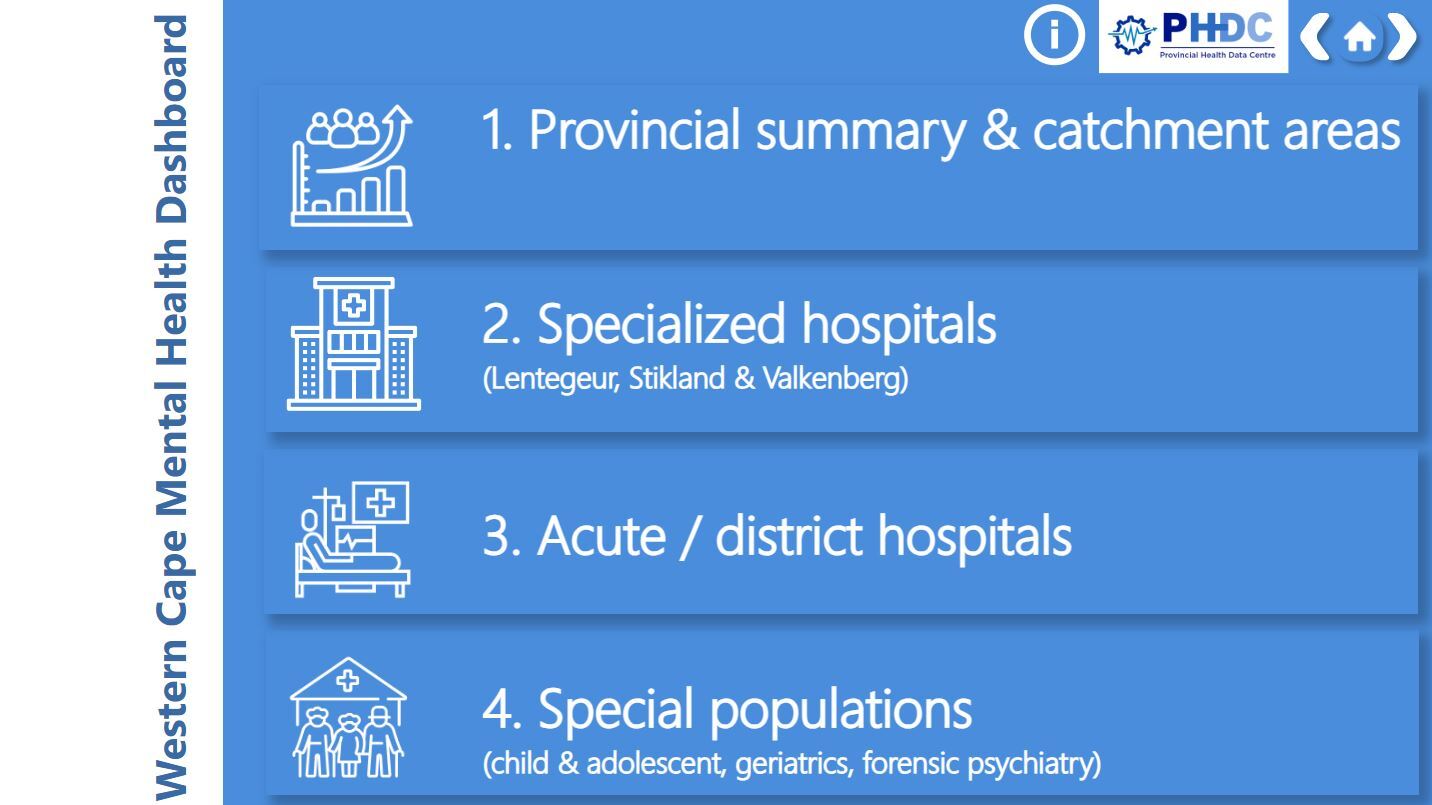
The metrics that can be displayed with the psychiatric admissions dataset described were identified to fall into four main groups: provincial and catchment area measures; psychiatric specialist facility measures; district and acute hospital measures, and measures for special population groups. The dashboard opens to a landing page with links for each group, directing the user to key topics within each group, as can be seen in Figure 1. The landing page includes an information button with a brief description of the dashboard, and each page includes a ‘home’ button that directs the user back to that page alongside buttons to navigate forwards and backwards through the dashboard pages.
Group 1: Provincial summary and catchment area
The first group provides province-level summary statistics for all psychiatric admissions in the province, as seen in Figure 2. This includes valuable surveillance metrics such as: yearly admission counts by hospital level; a moving average of daily admission counts; yearly median LOS, and the percentage of admissions divided by hospital level, rural/metro locality, broad diagnosis category, and discharge status, and repeat presentations in <30 days, 30─59 days, or 60─90 days.

The next pages in the first group contain similar measures aggregated by individual facility, provincial district, or catchment area for each of the specialist facilities, as well as re-admission rates within <30, 30─59, 60─89, 90─365, and >365 days, or first presentation aggregated by year as well as diagnosis category.
The last pages in the first group contain measures of whether admissions are flagged to contain substance-related diagnoses. These include yearly counts and proportions of substance-related admissions, median patient age by sex, and a substance-related flag, and proportions of substance-related admissions by sex and primary diagnosis category.
Group 2: Specialist psychiatric hospitals
The second group includes measures and summary statistics for admissions to psychiatric specialist hospitals. The first pages focus on admission trends at the specialist facilities, including yearly counts and proportions of admissions between the three specialist facilities, monthly admission counts stratified by ward, and the distribution of admissions over days of the week or time of day. The next pages focus on diagnosis trend measures at these facilities. Measures include: yearly counts and proportions of diagnoses stratified by diagnosis category; total distribution of diagnoses across diagnosis categories, as well as those stratified by patient sex and for substance-related patient admissions; median patient age stratified by sex and diagnosis category; the proportion of uni- and bipolar mood related diagnoses, and the proportion of substance-related diagnoses that are alcohol-related vs drug-related.
The ensuing pages of the specialist facility admission measures relate to metrics for repeat admissions such as the proportion of admissions that are repeat admissions with a previous psychiatric admission within <30, 30─59, 60─89, 90─365, or >365 days, or if the admission is a first presentation. Additionally, these proportions are stratified by year or diagnosis category. Also included are proportion of admissions that are repeat admissions with a previous psychiatric admission within 30, 60 or 90 days of admission. Similar proportions are also provided where the previous admission was at a specialist psychiatric facility.
The next few pages focus on measures describing direct admissions and admissions assumed to be referred from a prior facility due to a psychiatric admission discharge within a day of the specialist admission. Measures include counts and proportions of admissions that fall between these two categories, stratified by year and specialist facility. For admissions that were referred from a prior facility, pages are included for each specialist facility with measures of admission counts and proportions stratified by year and feeder facilities within their respective catchment areas, as well as the yearly median number of days admitted at these feeder facilities before transfer.
The succeeding pages display measures of patient LOS, bed occupancy rates (BORs) and utilisation of allied health services during in-patient stays. LOS metrics include mean and median LOS values for each specialist facility, with median LOS measures further stratified by year and diagnosis category or direct vs referred admissions. BORs are calculated at a ward level by aggregating bed-use-days for patients and dividing by bed numbers specified on Clinicom. Also included are counts and proportions of admissions with a LOS of 0─14, 15─28, 29─90, and >90 days, defined in the value specification phase by stakeholders. Measures for allied health service utilisation include: quarterly counts of visits to occupational therapy, psychology, and social work services during in-patient stay; as well as the proportions of specialist admissions that engaged with each of these respective services.
Still in the specialist admissions group, the next pages display measures for follow-ups and first-contacts post discharge. Follow-up metrics include yearly counts and proportions of admissions where the patient’s first-contact location matched the discharge destination specified on the discharge summary. Other measures include these proportions stratified by sex or diagnosis category, as well as proportions of whether the first-contacts were admissions or clinic/OPD visits (stratified by whether these contacts occurred within 30 days of discharge, year, or diagnosis category).
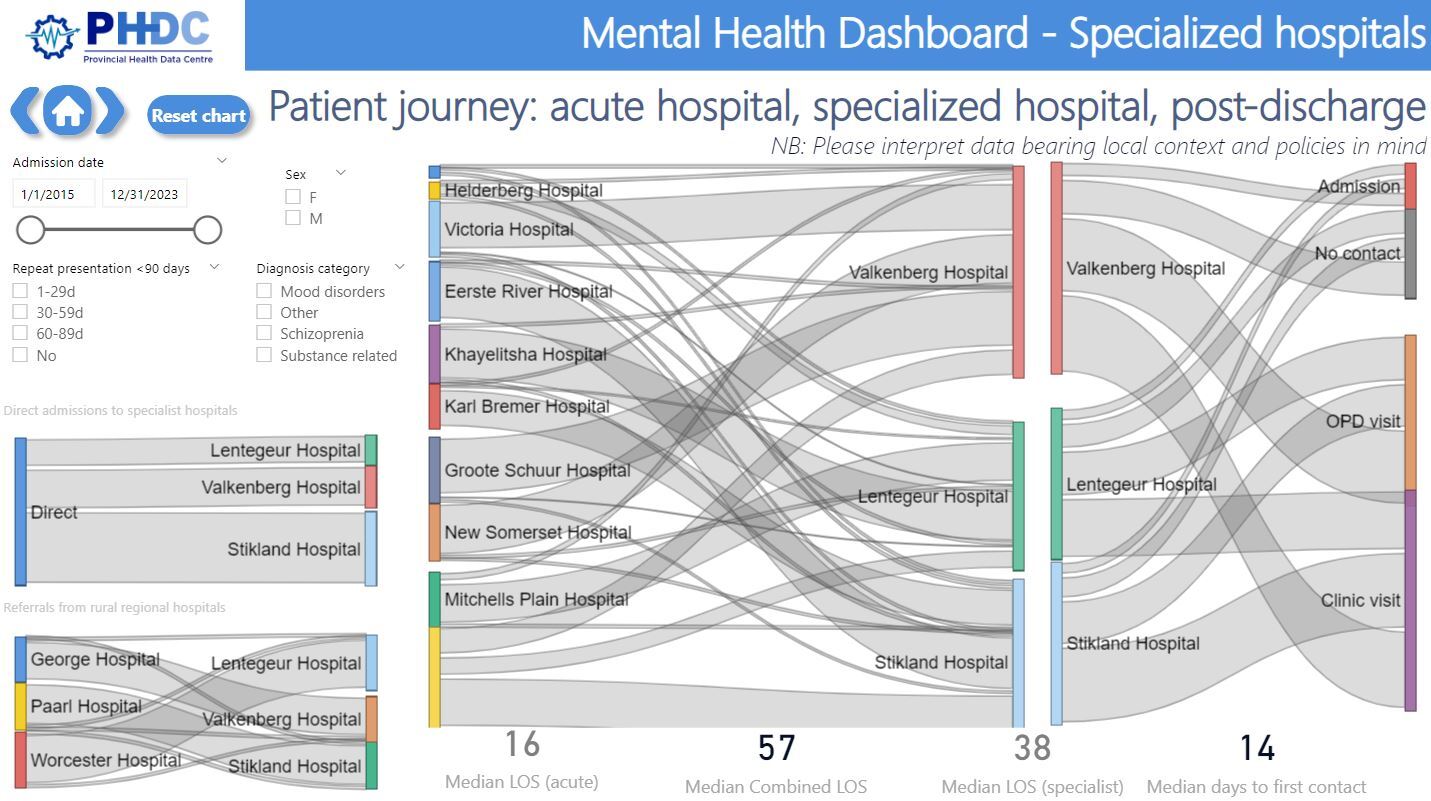
The final measures are an indication of the patient’s journeys through the MH care system using Sankey charts indicating the proportion of patient flows from the acute/district facilities to the specialist facilities and finally to each of the first-contact categories, as shown in Figure 3.
Group 3: Acute/district hospitals
The third group of admission measures is focused on summary statistics for admissions to acute/district hospitals. With the omission of the pages on the patient service journey, the measures visualised in this group utilised the same pages and metrics as described for the specialist facilities, except for replacing the pages relating to direct and referred-in admissions with pages showing measures of the counts and proportions of admissions that are discharged vs referred onwards.
Group 4: Special populations
The fourth and final group of admission metrics includes those relating to the description of special population groups. The first population group considered is the population of child and adolescent patients (<18 years). Surveillance measures included for this population are: sex-stratified median LOS; quarterly and yearly counts of admissions stratified by sex; the yearly proportion of admissions stratified by diagnosis category; discharge destination, and first-contact within 30 days of discharge. These metrics are also calculated for admissions to specialist child and adolescent mental health (CAMH) wards with the addition of median LOS stratified by year or diagnosis category.
The next population group considered is the geriatric population (>59 years), for which the same surveillance measures are calculated as described for the CAMH population. The final special population group includes measures relating to forensic psychiatric admissions. These measures include quarterly and yearly counts of admissions stratified by facility, the proportions of admission stratified by diagnosis category or sex, the median age stratified by sex, and the yearly median LOS stratified by sex.
Integration of the dashboard with the data sharing environment
With a first iteration of a completed prototype for the MH dashboard, the development process moved from the design phase to the implementation/operationalisation phase. This entailed the introduction of the tool to users and their training on its use to ensure the employment of the developed tool in practice. As described in the case description section for data-sharing, the PHDC makes use of a web-based SPV (Single Patient Viewer) platform to provide secure access to tools and healthcare data. By providing a link to the dashboard in this environment, stakeholders have a secure, access-controlled environment to engage with the dashboard through the Internet. The launch of the newly developed dashboard was accompanied by a digital announcement to all stakeholders informing them of its availability. Several demonstration workshops with stakeholders were also held to train users on how to access, navigate, and interpret the dashboard, and documentation outlining access to and navigation of the dashboard was distributed to stakeholders and added to the SPV.
Improvements and further development
Although a tool has been developed to meet the requirements established by users, the needs and challenges faced by any industry, including MH services, are constantly changing. This is why the evaluation phase and the iterative nature of the CeHRes Roadmap for eHealth development are vital components of the development framework. Users and stakeholders are encouraged to provide feedback and suggestions for the dashboard to advance its improvement and evolution to consistently meet user needs.
Findings
The number of mental health surveillance measures made available through this dashboard’s development have expanded significantly from the existing five described in the 2023─2030 National Mental Health Policy Framework and Strategic Plan. Additionally, several of the surveillance measures identified as ‘prioritised indicators’ in the Strategic Plan have been made available, such as the indicators relating to counts and waiting times for forensic observation and admission to specialist facilities; the indicator for re-admissions, and several measures in the dashboard that relate to the observation of patients identified and treated for mental health and using ambulatory services.13 Beyond making profound progress towards achieving the surveillance goals described in the strategic plan, the data beneficiation provided through the visualisation of these surveillance measures enables a wide range of MH stakeholders to rapidly identify associations and trends in MH service provision, as can be seen by the clearly increasing trend in admission counts in Figure 2.
Another benefit derived through the use of the Microsoft PowerBI environment is that all visualisations are beneficiated by a large degree of interactivity through data filters. Clicking on one component of a graphic can adjust other graphics on the page relative to the selected subset, as can be seen in Figure 4. This interactivity and ability to filter the data enables stakeholders not only to better engage with the surveillance measures and form a deeper understanding of data relationships, but also to adjust the cohort to groups or facilities that are more relevant to their individual interests or needs.

Since the launch of the dashboard, stakeholder feedback from clinicians, facility managers, and members of the health strategy directorate has been consistently positive. The dashboard has continued to feature as a key component in provincial health intelligence surveillance meetings and is frequently used to showcase the capabilities of the consolidated data environment at the PHDC.
Discussion
Generalisability of the model
With several of the core PHDC data sources, such as laboratory and disease register data, implemented at a national level,20 and the near universal implementation of a national unique identifier in primary care,21 the consolidation of healthcare data has begun to take place in other provinces and health jurisdictions in South Africa. Examples of this include the development of public health data centres in KwaZulu-Natal and the Eastern Cape. As the national healthcare environment shifts away from paper-based systems to consolidated electronic health records, it should be entirely possible for tools like the Mental Health Admissions Dashboard at the PHDC to be replicated in future.
Limitations in the data environment
With the dashboard’s focus limited to admitted patients, the derived surveillance measures will not be representative of either the MH burden or the MH patient cohort as they exclude patients with less severe MH conditions and do not accurately capture service activities at an out-patient level.
Another considerable limitation is the reliance on the quality of the data captured, such as the ICD-10 diagnostic coding, which is not consistently captured in a detailed and reliable manner. As discussed earlier in the population description, this limitation meant that in developing the dashboard, there was a need to rely on the admission specialty to identify psychiatric admissions, which excluded psychiatric patients admitted to Emergency Centres or other specialties. This exclusion causes an underestimation in the number of patients and has a marked impact on patients admitted for self-harm. This population of MH patients is particularly vulnerable and the need for better capturing of their interactions with health services is essential for improving treatment.
A lack of significant coverage of data capture at PHC level is also a significant limitation, as this excludes a significant portion of health services. Additionally, the gradual expansion of electronic data capture at this level will have a confounding effect on measured increases in PHC activity.
Challenges noted in dashboard development
A challenge to be noted in the development of the dashboard was the need to take contextual variation of policy and calculation into account when interpreting trends in the surveillance measures. For example, one facility may include both the admission and discharge day in the calculation of BOR, while another may not. This lack of standardisation could lead to facility managers mistrusting the data, as values on the dashboard may not align with their internally calculated figures. As all facilities fall within the Provincial Department of Health, the hope is to establish standardisation for data capture.
Another challenge in the development of the dashboard was the receipt of numerous requests for additions to the dashboard from various stakeholders. It was difficult to prioritise these in an equitable way.
Lastly, a challenge noted was that as the dashboard grew to include many pages, stakeholders struggled to find measures they were interested in and often incorrectly assumed that they were not available.
Recommendations
As mentioned earlier in the approach section, the value derived from putting together a multidisciplinary team of interested stakeholders cannot be over-emphasised. Their insight was invaluable when interpreting data trends and ensuring that the needs of surveillance were met along with those for service provision. Future interventions would do well to emulate this and draw on the expertise of their appropriate stakeholders.
Additionally, there is a notable lack of available data tools and infrastructure for mental health services in South Africa. This presents the opportunity to produce work with significant real-world impact with relative ease, so researchers and health service providers should not hesitate to begin developing tools based on available data that are the most complete, then gradually expand capabilities as the environment develops.
Conclusion
In conclusion, future initiatives should prioritise the formation of multidisciplinary stakeholder teams and capitalise on existing data to develop practical tools, recognising that even incremental progress in South Africa’s under-resourced mental health data infrastructure can yield substantial real-world benefits.