


Introduction
South Africa’s health landscape is shaped by entrenched socio-economic and environmental disparities, including elevated exposure to climate risks, persistent multidimensional poverty, and high unemployment.1 These factors intensify differential exposure and vulnerability to disease across provinces. South Africa also ranks among the top 25 countries globally for disability-adjusted life-years (DALYs) lost to mental disorders, with depression and anxiety alone accounting for an estimated 2.5 % of total years lived with disability.2
The country continues to bear the world’s largest national HIV burden. While diagnostic coverage is high, persistent gaps in treatment access and viral suppression, particularly among children, adolescents and key populations, underscore the need for targeted interventions.3 Tuberculosis (TB), including drug-resistant strains with modest treatment success rates, further compounds the epidemiological burden at the HIV and TB syndemic interface.4 Co-morbid depression and anxiety reduce antiretroviral adherence by up to 35%, amplifying morbidity and onward transmission risk.5
Maternal and neonatal health indicators reveal preventable mortality despite high institutional delivery rates and increasing caesarean section prevalence. This suggests that quality of care and emergency response capacity remain critical challenges. Declines in childhood immunisation coverage and under-five mortality rates that exceed Sustainable Development Goal (SDG) thresholds point to weaknesses in primary prevention systems. Concurrently, high levels of tobacco and alcohol use perpetuate avoidable burdens of chronic disease and injury.6,7 Emerging evidence links perinatal depression with suboptimal breastfeeding and immunisation uptake, underscoring the need for integrated maternal mental health services.8
Within this broader context, mental health has gained increasing policy and programmatic attention.9 Advances include the expansion of routine mental health indicators, the establishment of policy frameworks with defined targets, and the growth of longitudinal cohort platforms that enhance surveillance capacity. However, critical limitations persist. These include the limited integration of community-based and informal care data, insufficient disaggregation for equity-focused analyses, and inconsistent measurement standards. These gaps constrain the utility of available data for comprehensive planning, monitoring and evaluation. Productivity losses linked to untreated common mental disorders are estimated at 4–5% of South Africa’s gross domestic product (GDP), making mental health investment not only a rights imperative but also an economic priority.10
Health system performance and capacity constraints also affect the accessibility and quality of mental health services. These include uneven utilisation of primary health care (PHC), disparities in workload and bed occupancy, maldistribution of clinical and specialised human resources, and persistent financing inequities. Recent flood-related displacement in KwaZulu-Natal doubled the prevalence of post-traumatic stress symptoms among affected adolescents, highlighting how climate shocks magnify mental health needs.11
With a particular focus on mental health, this paper:
-
consolidates the most recent multisource indicators across key health domains, with an enhanced focus on mental health;
-
critically appraises the national health data architecture, including routine systems, longitudinal cohorts and administrative sources, highlighting strengths and limitations that affect interpretability and policy relevance; and
-
identifies cross-cutting challenges related to equity, quality and governance that should inform integrated policy development and resource allocation strategies in pursuit of universal health coverage and the Sustainable Development Goals (SDGs) for 2030.
Data sources
Box 1 lists the key new or updated international and national sources consulted for this analysis. Specific references and the current indicator definitions are provided in the data tables.
Mental health indicators
The availability of mental health indicator datasets in South Africa, as outlined in Table 1, provides a foundational basis for monitoring and evaluating mental health trends and service delivery across the country. These datasets ─ derived from global and local sources such as the GBD, the WHO’s Mental Health Atlas, the DHIS, Stats SA, and surveys such as the South African National and Nutrition Examination Survey (SANHANES) and South African National HIV Prevalence, Incidence, Behaviour and Communication Survey (SABSSM) VI ─ offer valuable insights into the burden of mental illness, service utilisation, and treatment coverage.
One of the key strengths of these datasets lies in their routine collection and national coverage, which allows for longitudinal tracking of mental health indicators at national and sub-national levels. This is particularly important for identifying regional disparities and informing targeted interventions. The inclusion of indicators such as the number of mental health admissions, outpatient visits, and availability of mental health professionals provides a comprehensive view of the mental health system’s capacity and performance. However, outcome-orientated metrics such as 30-day re-admission, relapse and remission rates remain largely absent. Incorporating such measures would allow for assessment of service effectiveness and progress towards recovery-focused care.
Several limitations constrain the utility of these datasets. Firstly, the reliance on administrative data may lead to under-reporting or misclassification, especially in under-resourced settings where data-quality assurance mechanisms are weak. Secondly, the indicators often focus on service outputs rather than outcomes, limiting the ability to assess the effectiveness of mental health interventions. Additionally, the absence of disaggregated data by age, gender and socio-economic status hampers equity analyses. A further blind spot is the near-total exclusion of community-based, informal and digital mental health services, despite evidence that they comprise up to 40% of first-contact care in rural districts.9
Despite the growing recognition of mental health as a public health priority, there remains a significant gap in the literature and policy discourse regarding the role and extent of private-sector service provision in South Africa. Much of the existing analysis tends to focus predominantly on public-sector challenges, thereby overlooking the contributions, limitations and regulatory complexities of private mental health care. This lack of comprehensive coverage obscures a full understanding of the mental health landscape, particularly in terms of access, equity and quality of care across socio-economic groups. Future iterations should routinely integrate Council for Medical Schemes (CMS) claims data and large-insurer electronic records to create a full system view.
Another critical gap is the limited integration of community-based and informal mental health services into the national reporting systems. Given the significant role of Traditional Health Practitioners and Community Health Workers in mental health care, their exclusion from official statistics presents an incomplete picture of service provision. Furthermore, the datasets do not adequately capture the social determinants of mental health, such as poverty, violence and substance abuse, which are essential for a holistic understanding of mental health trends.
To enhance the relevance and impact of mental health indicators, there is a need for improved data governance, including standardised definitions, regular audits, and capacity-building for data collection and analysis. Integrating mental health indicators into broader health and development monitoring frameworks, such as the SDGs, could also elevate their policy visibility and resource prioritisation.
Longitudinal datasets supporting mental health monitoring
The availability of longitudinal mental health datasets (Table 2) in South Africa represents a significant advancement in the monitoring and evaluation of mental health outcomes. These datasets, such as Birth-to-Forty (Bt40), Dikgale, Mamabolo and Mothiba (DIMAMO) health and demographic surveillance systems (HDSS), and the Drakenstein Child Health Survey (DCHS), provide valuable insight into the temporal dynamics of mental health conditions across diverse populations. Their longitudinal nature allows for the tracking of mental health trajectories, identification of risk and protective factors, and evaluation of interventions over time.
A key strength of these datasets lies in their diversity of target populations, ranging from children and adolescents to older adults, and their inclusion of both urban and rural settings. This heterogeneity enhances the generalisability of findings and supports the development of context-specific mental health policies. Moreover, the integration of mental health indicators into broader health and demographic surveillance systems, such as South African Population Research Infrastructure Network (SAPRIN) and Health and Ageing in Africa: A Longitudinal Study of an INDEPTH Community in South Africa (HAALSi), facilitates a more holistic understanding of mental health within the broader determinants of health framework.
However, several limitations must be acknowledged. Firstly, there is variability in the consistency and depth of mental health measures across studies, with some relying on self-reported symptoms and others using validated diagnostic tools. Secondly, access to data remains uneven, with some datasets being publicly available and others requiring direct contact with principal investigators, potentially limiting their utility for broader research and policy development. Thirdly, while many studies are ongoing, others have ceased data collection, raising concerns about sustainability and long-term impact.
The implications of these datasets for mental health policy and planning are profound. They offer a foundation for evidence-based decision-making, enable the identification of emerging trends, and support the evaluation of mental health interventions. To maximise their impact, efforts should be made to harmonise data-collection methodologies, ensure open access where feasible, and promote the integration of mental health indicators into national health information systems. Additionally, aligning indicator metadata with the WHO Indicator Metadata Registry List will facilitate international comparability.21
In conclusion, the landscape of mental health data in South Africa has evolved significantly, offering a diverse array of sources that collectively enhance understanding of mental health needs, service delivery, and population-level trends. Routine indicator datasets, such as those from the DHIS and national surveys, provide essential insights into system performance and access to care, while longitudinal cohort studies offer depth and nuance in understanding mental health trajectories over time. However, both types of data systems face challenges related to completeness, standardisation, and accessibility. Addressing these limitations through improved data governance, integration across platforms, and investment in sustainable data infrastructure is critical. Doing so will not only strengthen the evidence base for mental health policy and planning, but will also ensure that mental health is adequately prioritised within South Africa’s broader health and development agenda.
Demographic trends
On a global level, demographic transitions are reshaping health systems and policy priorities. Many countries are experiencing declining fertility rates, increasing life expectancy and ageing populations, which are trends that mirror South Africa’s shift from a youthful to a more mature population structure.40 These shifts are already changing the mental health profile where, for example, dementia prevalence is projected to double by 2040, while depression among older adults is rising in tandem with multimorbidity.41
According to the United Nations’ World Population Prospects (2024),42 the global fertility rate has dropped to 2.3 children per woman, with significant regional variation. High-income countries often report rates below replacement level, while parts of sub-Saharan Africa still experience higher fertility.
Urbanisation
Urbanisation continues to accelerate worldwide, with over 56% of the global population now residing in urban areas. This trend places immense pressure on urban infrastructure, housing and health services, particularly in rapidly growing cities across Asia and Africa.43 South Africa’s concentration of population in Gauteng and KwaZulu-Natal reflects this global urban shift. Rapid urban growth is associated with increased exposure to crime, social isolation and ‘eco-anxiety’, which are all recognised drivers of common mental disorders in young adults.44
Ageing index
Ageing populations, especially in Europe, East Asia, and parts of Latin America, are driving demand for chronic disease management, geriatric care, and long-term health financing strategies. The global ageing index is rising, with countries like Japan and Italy already facing ratios above 50.42 South Africa’s ageing index of 33.5 suggests that it is entering this phase, necessitating proactive planning for age-appropriate services. Provincially, the Western Cape (33.1) and Gauteng (26.8) reflect more advanced demographic transitions compared to provinces like KwaZulu-Natal and Limpopo (both 18.8). This shift has implications for the burden of non-communicable diseases and the design of age-appropriate health services. Integrating geriatric psychiatry and caregiver-support indicators into routine surveillance would provide an early warning of service gaps.45
Population and births
The 2024 mid-year population estimates from Statistics South Africa34 reveal a national population of just over 63 million, with Gauteng (25.3%) and KwaZulu-Natal (19.5%) together accounting for nearly 45% of the total. Mental health-related disability benefits already cluster in these two provinces, highlighting the importance of co-locating psychosocial services within existing urban PHC networks. This concentration underscores the continued urbanisation trend and the associated pressure on infrastructure and health services in these provinces.
Live birth registrations in 2023 totalled 932 138, with the highest numbers recorded in Gauteng (219 023) and KwaZulu-Natal (205 831), aligning with their population shares. However, the total fertility rate has declined to 2.4 children per woman,34 indicating a continued demographic transition. This is also reflected in Figure 1 which shows that between 2004 and 2024, South Africa’s population pyramid transitioned from a youthful, broad-based structure to a more column-like shape, reflecting declining birth rates, a growing working-age population, and an increasingly ageing society. The crude death rate is estimated at 8.7 per 1 000 population, although provincial disaggregation is lacking, which limits more granular mortality analysis.
.png)
Population density figures highlight stark contrasts where Gauteng’s density of 876.4 people/km² far exceeds the national average of 51.6, while the Northern Cape remains sparsely populated at just 3.7 people/km² (Table 3). High-density informal settlements report up to three-fold higher rates of depression and alcohol-use disorders than rural areas.46 These disparities have direct implications for service delivery models, with rural provinces requiring logistical and infrastructural approaches that differ from those needed in urban centres.
Uninsured population estimates
The reliance on public health systems is a common feature in many low- and middle-income countries. With 85% of South Africans being dependent on public health services, the challenge of equitable resource allocation is shared globally.32 Incorporating a short validated mental health screening tool (e.g. PHQ-9, GAD-7) into the next General Household Survey (GHS) would enable province-level prevalence estimates for the first time.
As the estimated uninsured populations per province and district are important denominators for a wide range of indicators, the estimates of the uninsured population in South Africa down to district level has been updated (Table 4). The proportion of uninsured to insured individuals has not shifted significantly in recent years, as high costs continue to pose a barrier to private medical aid. Nevertheless, regular updates to these estimates are essential to ensure continued relevance and accuracy in health system planning and decision-making.
Methodology
To estimate the uninsured population per district, estimates of medical scheme coverage at that level were first determined. The GHS captures medical scheme coverage; however, it is statistically representative at the provincial level. The Census, on the other hand, provides detailed population data at the district level but does not record medical scheme coverage. Applying the average provincial medical scheme coverage from the GHS to all districts in the Census would not accurately reflect district-level demographics, as key factors influencing coverage (such as income or educational level) can vary greatly between districts, even within the same province.
To create a representative estimate, a small area estimation model was built to estimate medical scheme coverage within districts in provinces. The model was trained on the GHS 202432 using key variables to predict medical scheme coverage. The relationships between these variables were then used to predict coverage probabilities for households in the Census 2022 microdata. This approach enabled more granular and realistic estimates at the district level, overcoming the limitations of both datasets when used in isolation. A more detailed methodology is available on request.
Results
The small area estimation model produced detailed estimates of medical scheme coverage across South African districts. The key findings showed that medical scheme coverage rates differ between districts within provinces, as expected. These results highlight the socio-economic and demographic differences that cannot be captured by high-level provincial averages alone. The updated estimates indicate that approximately 84.3% of the population remains uninsured nationally, with higher uninsured proportions being concentrated in rural and lower-income districts.
Socio-economic and environmental risk factors
Across the globe, socio-economic and environmental determinants are increasingly recognised as critical drivers of health outcomes. Crucially, they also explain an estimated 30–40% of the variance in common mental disorder prevalence, underscoring why mental health cannot be separated from broader development agendas.47 The WHO and United Nations Development Programme (UNDP) have consistently highlighted how poverty, lack of access to quality education, unemployment, inadequate housing, and harmful environmental exposures shape population health and contribute to widening health inequities.
Air pollution
Air pollution is now the second-largest leading risk factor for premature death world. The impact of particulate matter (PM2.5) on global life expectancy is comparable to that of smoking, more than four times that of high alcohol use, more than five times that of transport injuries like car crashes, and more than six times that of HIV/AIDS.48 According to the 2024 State of Global Air Report, 99% of the world’s population lives in places with unhealthy levels of PM2.5 pollution, and air pollution from PM2.5 and ozone was estimated to contribute to 8.1 million deaths worldwide.48 Urban centres in South and East Asia, parts of Africa, and Latin America face particularly high PM2.5 levels, mirroring the challenges seen in South Africa’s industrial provinces like Gauteng and Mpumalanga. Long-term exposure to PM2.5 is also linked to higher odds of depression (OR 1.11 per 10 µg/m³) and cognitive decline,49 making clean-air policy a mental health as well as a cardiovascular imperative. In 2022, Gauteng recorded the highest PM2.5 levels at 43.14 µg/m³, followed by Free State (26.08) and Mpumalanga (22.76), all well above the WHO guideline of 5 µg/m³.17 Western Cape, by contrast, reported the lowest level at 4.3 µg/m³, reflecting regional disparities in environmental exposure.
Poverty
Multidimensional poverty remains a global concern, especially in low- and middle-income countries. In South Africa, adults living in the bottom income quintile face twice the prevalence of psychological distress compared with the top quintile.50 While global extreme poverty has declined, over 1.1 billion people still experience multidimensional poverty, with the largest burdens occurring in sub-Saharan Africa and South Asia. Like South Africa, many countries face overlapping deprivations in health, education and living standards, which compound vulnerability to disease and limit access to care.1 South Africa’s Human Development Index (HDI) stands at 0.7, placing it 105th globally which is indicative of moderate development but persistent inequality. While only 0.9% of the population is classified as being in severe multidimensional poverty, 12.2% are considered as being vulnerable to it.1 The largest contributor to deprivation is standard of living (47.4%), followed by health (39.5%) and education (13.1%). These figures highlight the interlinked nature of poverty and health, where inadequate housing, poor nutrition, and limited access to services compound health risks. Notably, 3% of adults aged 20 years and older have no formal schooling, with the highest rates recorded in Limpopo (5.7%) and Mpumalanga (5.5%).32
Unemployment
Unemployment and under-employment are global challenges, especially among youth, which in South Africa exceeds 45%.33 The International Labour Organization (ILO) reports that youth unemployment rates are three times higher than adult rates globally, with significant implications for mental health, social cohesion, and long-term economic stability.51 The official unemployment rate remains high at 32.9%, with Eastern Cape (39.3%), North West (40.4%), and Free State (37.9%) facing the highest rates. Western Cape, at 19.6%, is the only province below 20%, reflecting stronger labour market absorption.33
Climate change
Climate change amplifies existing vulnerabilities. The April 2022 floods in KwaZulu-Natal doubled probable post-traumatic stress symptoms among displaced adolescents,11 illustrating how extreme weather fuels mental health crises. Rising temperatures, extreme weather events and environmental degradation disproportionately affect low-income populations and exacerbate health risks. Countries worldwide are increasingly adopting a ‘Health in All Policies’ approach to address these interconnected challenges through multisectoral collaboration.52
Housing and basic services
Housing and basic service access indicators further illustrate inequality. Nationally, 84.1% of households live in formal dwellings, but informal housing remains prevalent in provinces like Western Cape (18.6%) and North West (17.2%). Access to piped water is high nationally (87.7%) but drops to 62.9% in Limpopo and 69.9% in Eastern Cape. Similarly, access to improved sanitation is lowest in Limpopo (62.2%) and Mpumalanga (66.6%), compared to 97.1% in Western Cape.32
These socio-economic and environmental indicators, as illustrated in Table 5, underscore the need for a multisectoral approach to health. Health system interventions alone are insufficient. Progress towards universal health coverage and improved population well-being will require co-ordinated action across housing, education, employment, sanitation, and environmental regulation. Embedding health equity into all policies and strengthening interdepartmental collaboration are essential to mitigate the health impacts of socio-economic and environmental risk factors.52
HIV
Although significant progress has been made in prevention, diagnosis and treatment, HIV remains a major public health challenge. According to UNAIDS,19 approximately 39 million people are living with HIV worldwide, with sub-Saharan Africa accounting for nearly two-thirds of the global burden. South Africa continues to have the highest national prevalence, but similar patterns are observed in countries like Nigeria, Mozambique, and Kenya.19
The global push toward the UNAIDS 95-95-95 targets for epidemic control has seen uneven progress. While many high-income countries have achieved or are close to achieving these targets, several low- and middle-income countries still face gaps, particularly in treatment access and viral suppression among adolescents and key populations. These gaps are likely to worsen due to the cuts in US funding for HIV programmes, which have already led to declines in testing and treatment in several countries. The results from a recent modelling exercise show that longer-term reductions in donor funding could lead to an additional 10.8 million HIV infections and 2.9 million deaths by 2030, over and above what would have occurred with the support of HIV programmes remaining in place.53
According to Thembisa v4.7,38 KwaZulu-Natal (1.95 million) and Gauteng (1.86 million) account for nearly half of all people living with HIV (PLHIV) in South Africa, underscoring the need for sustained, province-specific responses. The South African National AIDS Council’s (SANAC) National Strategic Plan (NSP) 2023─20283 outlines ambitious targets for HIV and TB to help South Africa eliminate these diseases as public health threats by 2030.
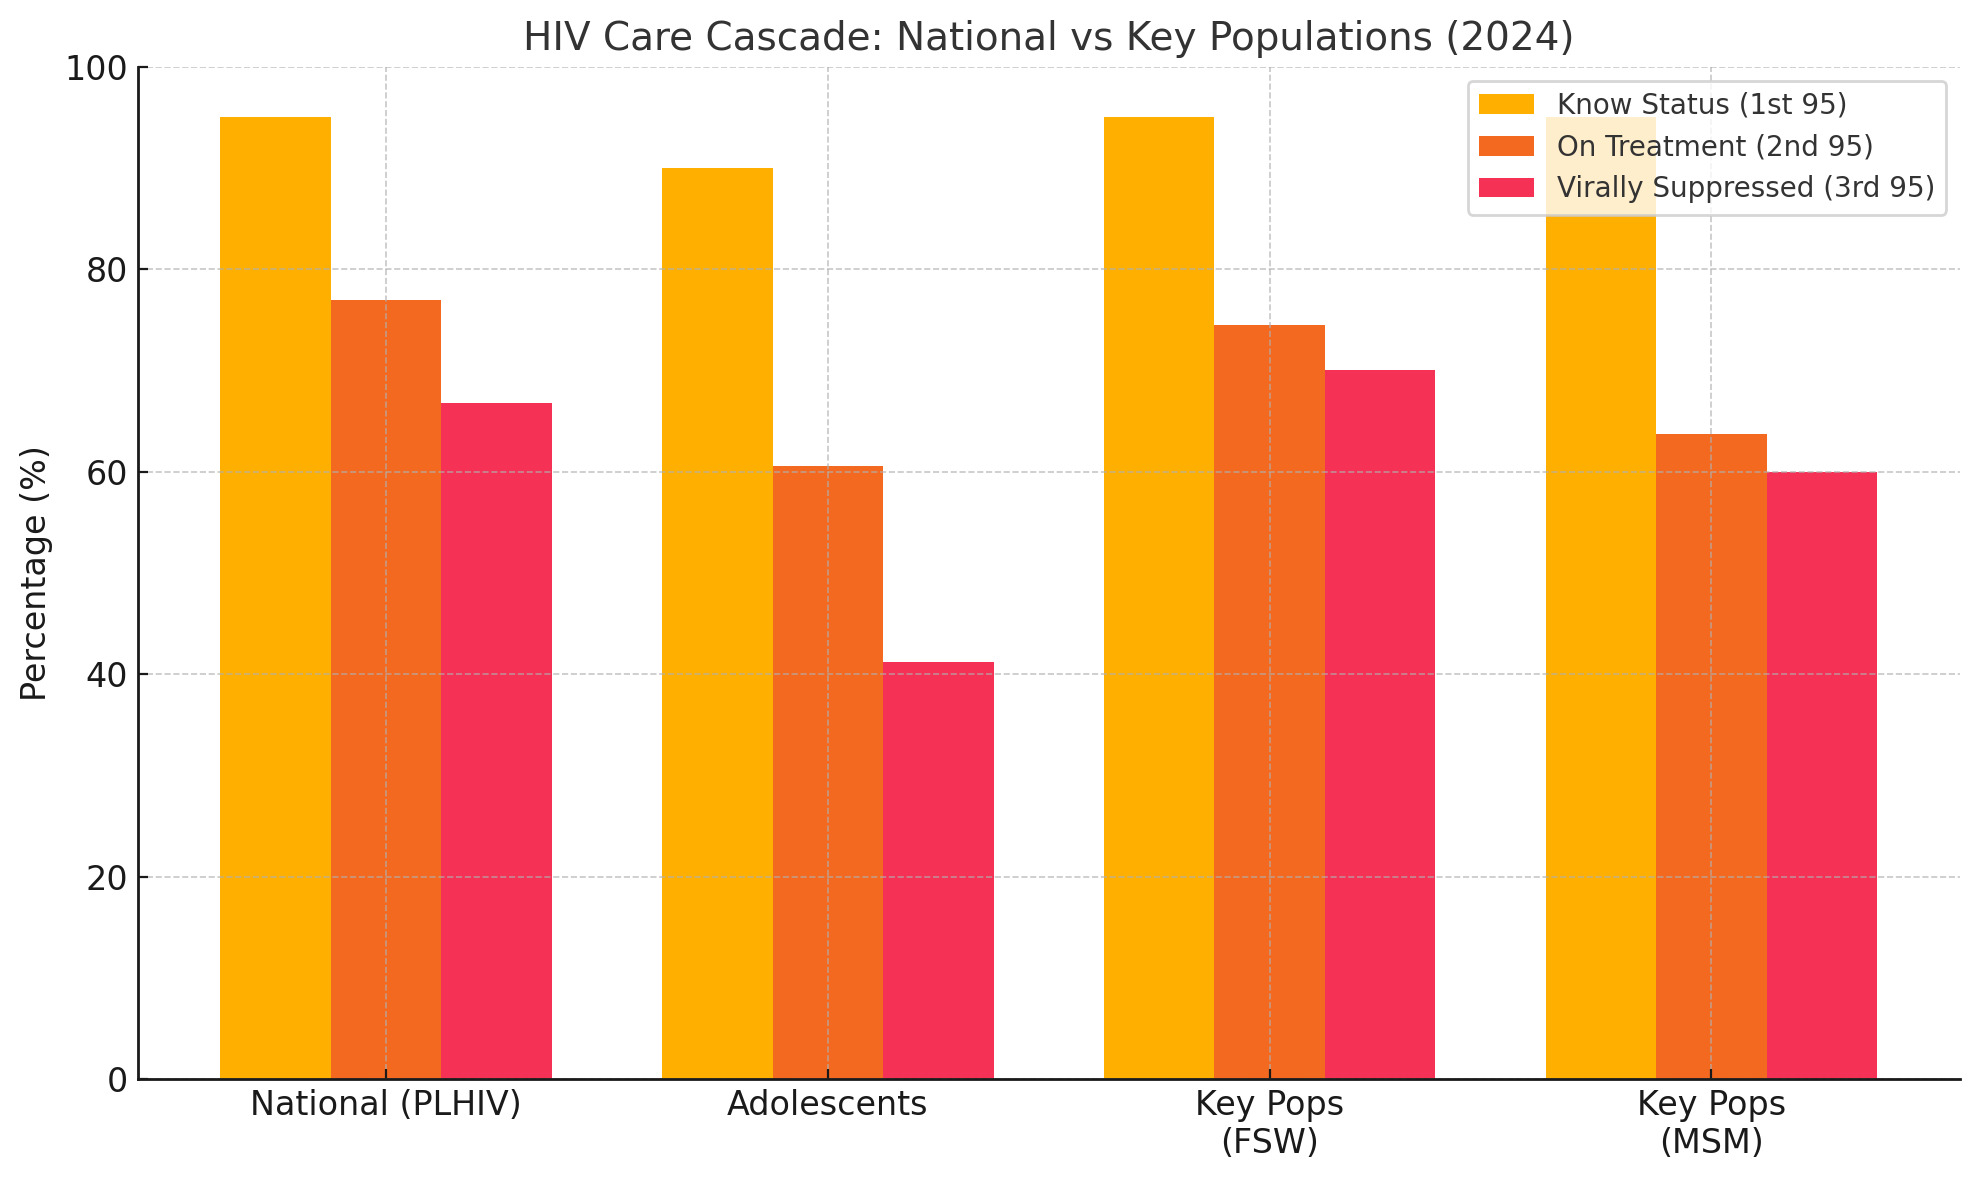
Encouragingly, the first 95 target, which is knowledge of HIV status, has been largely achieved, with 95% of PLHIV being aware of their status.19 However, gaps remain in treatment and viral suppression, particularly among adolescents and key populations.
HIV prevalence
HIV prevalence among antenatal clients aged 15–49 remains high at 21.5% in 2024, with the highest rates shown in KwaZulu-Natal (27.3%) and Mpumalanga (28.1%).38 These figures reinforce the need for integrated sexual and reproductive health services and continued investment in prevention of mother-to-child transmission (PMTCT) programmes.
The data also highlight the disproportionate burden among key populations, where HIV prevalence is estimated at 62.3% among sex workers, 58.0% among transgender people, and 29.7% among men who have sex with men.19 This calls for targeted, rights-based interventions and the removal of structural barriers to care ─ even more so as key populations are being disproportionately affected by the US funding cuts which specifically prevent any funding in HIV programmes being allocated to support them.
Antiretroviral therapy coverage
In response to the global funding cuts, South Africa launched the Close the Gap campaign in February 2025 which aims to enrol an additional 1.1 million PLHIV on life-saving treatment by the end of 2025.53 According to the 2024 DHIS data, antiretroviral therapy (ART) coverage (the second 95) stands at 77.1% nationally, but is notably lower among children aged 0–14 (60.6%) and youth aged 15–24 (54.3%). Provinces such as Limpopo (65.1%) and Mpumalanga (73.4%) fall below the national average, while KwaZulu-Natal leads with 86.6% coverage.39 Among key populations, ART coverage is highest among female sex workers (74.5%) and lowest among men who have sex with men (63.7%), reflecting persistent barriers to access and stigma.19
Viral suppression
As illustrated by Figure 2, viral load suppression (the third 95) remains below target at 66.8% nationally, with even lower rates among children (41.2%) and men aged 15 and older (61.3%). Western Cape (54.4%) and KwaZulu-Natal (78.8%) show the widest provincial variation, highlighting the importance of differentiated care models and adherence support.54
HIV and mental health integration
Mental health integration into HIV care is gaining traction worldwide. The bidirectional relationship between HIV and mental health, whereby depression, anxiety and trauma affect ART adherence and outcomes, is increasingly recognised. Countries like Brazil and Thailand have begun to embed psychosocial support into HIV programmes, aligning with South Africa’s strategic emphasis on integrated care.55 The 2023–2028 NSP3 explicitly elevates mental health within Goal 1, Objective 1.7 “Integrate and standardise delivery and access to mental health services”, recognising the bidirectional links between HIV, TB, sexual and gender-based violence (SGBV), human rights violations, inequalities, and mental health. By foregrounding integration, the NSP positions routine HIV/TB platforms as entry-points for early identification of depression, anxiety and trauma, and for referral pathways that include psychosocial support, law and policy reform, redress mechanisms, dignified survivor-centred services, and sensitised health facilities and personnel. This strategic emphasis strengthens the rationale for embedding mental health screening and support within adherence clubs, adolescent/youth models, PMTCT, and key population programmes to accelerate progress towards achieving the second and third 95s (Table 7).3
Tuberculosis
Tuberculosis remains one of the top infectious disease killers, with an estimated 10.6 million people falling ill and 1.3 million deaths in 2023, according to the WHO Global TB Report.13 The burden is disproportionately concentrated in low- and middle-income countries, with India, Indonesia, China, the Philippines, Pakistan, Nigeria, and Bangladesh accounting for two-thirds of global cases. Drug-resistant TB poses a growing threat worldwide, with nearly half a million cases of rifampicin-resistant TB reported annually. Treatment success rates for multidrug-resistant TB (MDR-TB) remain below 60% globally, mirroring challenges seen in South Africa.13
Integration of TB and HIV services is a global priority, especially in high-burden regions. Innovations such as shorter treatment regimens, digital adherence technologies, and community-based care models are being scaled up to improve outcomes. Similar to the national Close the Gap campaign for HIV epidemic control, the End TB campaign in South Africa is a national effort to reduce TB incidence and mortality by 2035. The campaign’s initial phase focuses on expanding TB testing to reach 5 million people by 2025/26, with the goal of diagnosing 250 000 new TB cases. This effort is part of a broader strategy to eliminate TB as a public health threat in South Africa. Achieving the End TB targets will require sustained investment, political commitment, and multisectoral action to address the social determinants of TB, including poverty, malnutrition, and housing conditions.56
TB incidence
With an estimated incidence rate of 427 per 100 000 population in 2023,13 South Africa remains among the top 10 countries with the highest burden of TB, accounting for two-thirds of all TB infections globally.3 Among PLHIV, the incidence is particularly high at 230 per 100 000, reflecting the persistent syndemic relationship between TB and HIV. Similar to HIV, the SANAC NSP 2023─2028 outlines South Africa’s targets for TB for 2028, which are outlined in Table 8. The targets include increasing the TB case detection rate to 95% from 77% in 2022,57 indicating that nearly a quarter of cases may remain undiagnosed or unreported. In addition to this, the NSP seeks to increase TB treatment success across all forms of TB to 95% by 2028.3
Drug-resistant TB
Drug-resistant TB continues to pose a significant threat. In 2022, 7 109 MDR-TB patients were recorded in the national cohort, with KwaZulu-Natal (1 736) and Eastern Cape (1 610) reporting the highest numbers.58 Treatment outcomes remain suboptimal: the national MDR-TB treatment success rate was 62.4%, with Western Cape trailing at just 52.5%. Loss to follow-up rates were also high, particularly in Western Cape (24.2%) and Gauteng (20.6%), suggesting systemic challenges in patient retention and adherence support.
Extensively drug-resistant TB (XDR-TB) outcomes are even more concerning. The national XDR-TB treatment success rate was only 51.0%, with mortality rates reaching 34.8% in Mpumalanga and 34.3% in Northern Cape. These figures highlight the urgent need for improved diagnostics, second-line treatment access, and patient-centred care models.
HIV and TB co-infection
The intersection of TB and HIV remains a critical concern. In 2022, 54% of TB incident cases were co-infected with HIV in South Africa, and the TB mortality rate among PLHIV was 49 per 100 000 in 2023.13 While the overall TB mortality rate has declined to 90 per 100 000, the mortality rate in South Africa remains among the highest globally. Notably, the mortality rate excluding HIV has plateaued at 39 per 100 000, indicating that broader TB control efforts must be intensified beyond the HIV-positive population. Interestingly, the 2021 StatsSA Causes of Death report showed that TB went from being ranked as the second-highest cause of death in 2019 (accounting for 5.5% of deaths) to the seventh-highest cause of death in 2021 (accounting for 2.9% of deaths).35
Efforts to address the social determinants of TB must also extend to the psychological and emotional well-being of patients. Depression, anxiety and stress not only reflect social disadvantage but also pose direct barriers to achieving the End TB targets, as demonstrated by a global review and meta-analysis. The review, which included a pooled estimate of 8 086 TB patients, reported a prevalence of 32.5% for anxiety, 32.9% for comorbid depression, and 52.7% for stress with the highest prevalence reported in the African region.35 More locally, a qualitative study based in Khayelitsha, Cape Town, found that patients living with HIV-associated TB scored higher in themes related to physical, social, and mental health aspects of health-related quality of life (HRQoL) assessments. In particular, concerns and coping within the mental health domain emerged as dominant themes.59
While individual studies have explored the psychological impact of HIV and TB separately,60,61 there is a notable lack of nationally representative evidence focusing specifically on the psychosocial experiences of those co-infected with HIV and TB. This represents a critical research gap, particularly in high-burden settings like South Africa, where understanding and addressing the compounded mental health challenges of co-infection could significantly improve care outcomes. Taken together, these global and local findings underscore the need to integrate psychosocial support into TB and HIV programmes as a core component of achieving the End TB targets.
These indicators underscore the need for a re-invigorated TB response that integrates prevention, early detection and treatment adherence, while ensuring alignment with HIV care services for individuals with HIV/TB co-infection. Strengthening community-based care, expanding access to newer TB regimens, and addressing social determinants such as poverty and malnutrition will be essential to achieving the End TB targets (Table 8).62
Maternal and reproductive health
Maternal mortality ratio
According to WHO, the global maternal mortality ratio declined by over 40% between 2000 and 2023, but progress has stalled in many low- and middle-income countries. Sub-Saharan Africa continues to account for approximately 70% of global maternal deaths, with leading causes including haemorrhage, hypertensive disorders, and sepsis.64
The institutional maternal mortality ratio (iMMR) was 111.7 per 100 000 live births in 2023 in South Africa, with the highest provincial ratios found in North West (156.5), Free State (139.5), and Eastern Cape (140.4).30 These figures contrast with the WHO national estimate of 118 per 100 000, highlighting discrepancies between facility-based and modelled estimates. Routine DHIS data show a similar picture, with an overall facility ratio of 101 and the same provinces at the extremes. More than half of these deaths are still judged as preventable, underscoring ongoing gaps in the timeous management of haemorrhage, hypertension and infection.30
Access to skilled birth attendance
Although access to skilled birth attendance has improved ─ reaching 87% in 2024 ─ the quality of care and emergency obstetric services remains uneven. Caesarean section rates are rising worldwide, with some countries exceeding the WHO-recommended threshold of 10–15%, raising concerns about over-medicalisation.65 In contrast, many low-resource settings still face barriers to timely surgical intervention. Nationally, the institutional delivery rate stands at 78.4%, with Limpopo (90.3%) and Free State (85.5%) outperforming the national average, while Northern Cape (69.4%) and Eastern Cape (71.2%) lag behind.39 Caesarean section rates remain high at 32.4% nationally, with KwaZulu-Natal reporting the highest rate at 38.9%, raising questions about clinical appropriateness and access to emergency obstetric care.39
Contraception
Access to modern contraception has expanded globally, yet unmet need remains high in parts of South Asia and sub-Saharan Africa. The global health community increasingly emphasises respectful maternity care, adolescent-friendly services, and integration of sexual and reproductive health with HIV and mental health services.66 These global trends offer important lessons and benchmarks for South Africa’s ongoing efforts to improve maternal and reproductive health outcomes.
Teenage pregnancy
High adolescent fertility rates remain a concern in many regions, particularly in West and Central Africa, where rates exceed 100 births per 1 000 girls aged 15–19 years.64 In South Africa, teenage pregnancy remains a significant concern, where over 122 000 facility-based deliveries were recorded among girls aged 10–19 years. KwaZulu-Natal (31 088) and Gauteng (19 836) accounted for the highest numbers. Statistics South Africa’s Vital Registration Register mirrors the magnitude of the problem, logging just over 100 000 live births to 15–19-year-olds in 2023.36 The facility delivery rate for this age group is 14.1%, peaking at 18.0% in Eastern Cape.39 Condom use among young women aged 15–24 has declined to 26.2% nationally, according to THEMBISA 4.7,38 suggesting a worrying trend in sexual risk behaviour. The trend threatens to undermine gains in HIV prevention and heightens the risk of unintended and unsupported pregnancy.
Neonatal deaths
Neonatal outcomes have barely shifted. The facility-based neonatal mortality rate stands at 9.9 deaths per 1 000 live births, down slightly from recent years but stubbornly high in Free State and Northern Cape and at its lowest in Western Cape. While the WHO estimates are not disaggregated provincially, neonatal mortality remains high at 11.6 per 1 000 live births,67 underscoring the need for improved perinatal care, as this rate has increased from 2021.
Termination of pregnancies
The data also show that 137 331 terminations of pregnancy (ToPs) were performed in 2023, with Gauteng (35 363) and Western Cape (20 624) leading in service provision.39 This reflects both access and demand, but also points to the need for strengthened contraceptive services and post-abortion care.
These indicators reveal a health system that is succeeding at bringing more women into care earlier, but has yet to translate such access into faster reductions in maternal and newborn deaths. Closing the provincial equity gaps, re-energising HIV and pregnancy-prevention efforts among adolescents, and sharpening the quality of intrapartum and emergency obstetric care will be critical if South Africa is to restart progress towards achievement of the SDG targets for 2030.
Perinatal mental health challenges and economic considerations
A review informed by a significant proportion of South African studies suggests that women in Africa experience a range of perinatal mental disorders, including depression and psychosis, often linked to socio-economic and poverty-related factors operating at multiple levels.68 However, evidence on the health and social impacts of these conditions, the availability of context-specific interventions, and patterns of mental healthcare use remains limited.68 In quantifying the economic toll, models suggest that perinatal depression and anxiety in South Africa account for a lifetime cost of USD 2.8 billion per annual birth cohort ─ a figure that rises when post-traumatic stress disorder is included.69 Despite progress in mental health policies and interventions, there remains a significant gap in economic investment to meet perinatal mental health needs, which in itself is a barrier to meeting these needs (Table 9).
Child health
Child health has seen significant improvements over the past decades, yet disparities remain stark across regions. According to UNICEF and WHO, global under-five mortality has declined by over 50% since 1990, but sub-Saharan Africa still accounts for more than half of all under-five deaths. Immunisation coverage has plateaued in many countries, with the COVID-19 pandemic causing setbacks in routine vaccinations. In 2023, an estimated 25 million children missed out on essential vaccines worldwide.15
Malnutrition continues to be a leading cause of child morbidity and mortality, with 148 million children under five being affected by stunting and 45 million by wasting. Conversely, childhood obesity is rising, particularly in middle-income countries, posing new challenges for health systems. Mental health and developmental delays are also gaining attention, with global initiatives calling for integrated early childhood development programmes. These global trends underscore the need for resilient PHC systems, equitable access to services, and targeted interventions to address both infectious and non-communicable threats to child health.18
Immunisation
Child health outcomes in South Africa continue to reflect both progress and persistent gaps in service coverage and equity. Immunisation coverage has declined across several key vaccines: BCG coverage dropped from 79% in 2023 to 74% in 2024, and DTP3 coverage also stands at 74% from 79% in those same years.15 Measles coverage shows slightly better performance in 2024, with 81% for the first dose and 82% for the second dose, yet still falls short of the 95% target required for herd immunity.
The pneumococcal conjugate vaccine (PCV) third-dose coverage also declined slightly from 83% in 2023 to 81% in 2024, mirroring the trend seen in other immunisation indicators. This decline may reflect broader systemic issues in routine child health services, including supply-chain constraints and workforce shortages, challenges in vaccine uptake (possibly linked to service disruptions), vaccine hesitancy, and access barriers.70
Child mortality
Under-five mortality remains a pressing concern. According to the UNICEF State of the World’s Children Report, the 2023 estimate for South Africa was 34.7 deaths per 1 000 live births, with boys (37.2) experiencing higher mortality than girls (31.9).18 The 2024 mid-year estimate34 shows a modest improvement to 28.6, but this still exceeds the SDG target of 25 per 1 000. Similarly, child mortality in the 1–4-year age group was 10.4 per 1 000 in 2023, again with higher rates among boys (11.1) than girls (9.8).21
Orphanhood
Orphanhood data from the 2024 GHS32 reveals concerning levels of parental orphanhood among children under 18 years. Nationally, 7.6% of children are paternal orphans, with Free State (10.7%) and Northern Cape (9.3%) reporting the highest rates. Maternal orphanhood is lower at 2.7% nationally, but still significant, particularly in Western Cape (4.3%). These figures underscore the need for strengthened social protection and psychosocial support for vulnerable children.
Collectively, these findings underscore the need to reinvigorate primary health care and immunisation outreach, especially in under-served areas, by bolstering health information systems, optimising vaccine delivery, and tackling the social determinants that shape child health.70
Balancing challenges and resilience in orphaned adolescents
Addressing the mental health challenges of orphaned and vulnerable children is critical, yet nationally representative data remain scarce. Evidence from a study conducted in the City of Tshwane shows a 21% prevalence of depressive symptoms among orphaned adolescents in township secondary schools.71 Further research on maternally orphaned adolescents reveals maladaptive behaviours, including suicidal thoughts, poor self-perception, silence, psychological distress, risky behaviours, and social withdrawal.72 In contrast, a more recent study by the same authors identifies protective behaviours among some orphans, such as resilience fostered through participation in meaningful daily activities.73 Taken together, these findings point to both significant vulnerabilities and notable strengths among orphaned adolescents, underscoring the urgent need for nationally representative studies to inform targeted mental health interventions more effectively (Table 10).
Non-communicable diseases
The global rise of non-communicable diseases (NCDs), driven by ageing populations, urbanisation, unhealthy diets, physical inactivity, tobacco use, and harmful alcohol consumption is the leading cause of death, accounting for over 70% of all deaths worldwide. Cardiovascular diseases, cancers, chronic respiratory diseases, and diabetes are the most prevalent, with low- and middle-income countries bearing over 85% of premature deaths. The mortality rate from major NCDs among adults aged 30–70 years is 22.7%,7 reflecting the cumulative impact of late diagnosis, poor treatment adherence, and limited access to quality chronic care.74
Mental health
Mental health, which is often under-recognised, is increasingly prioritised in global health agendas, with the WHO Comprehensive Mental Health Action Plan 2013–2030 calling for universal access to mental health care. Suicide mortality remains high globally at 22.3 per 100 000, highlighting the intersection of mental health and broader NCD burdens.75
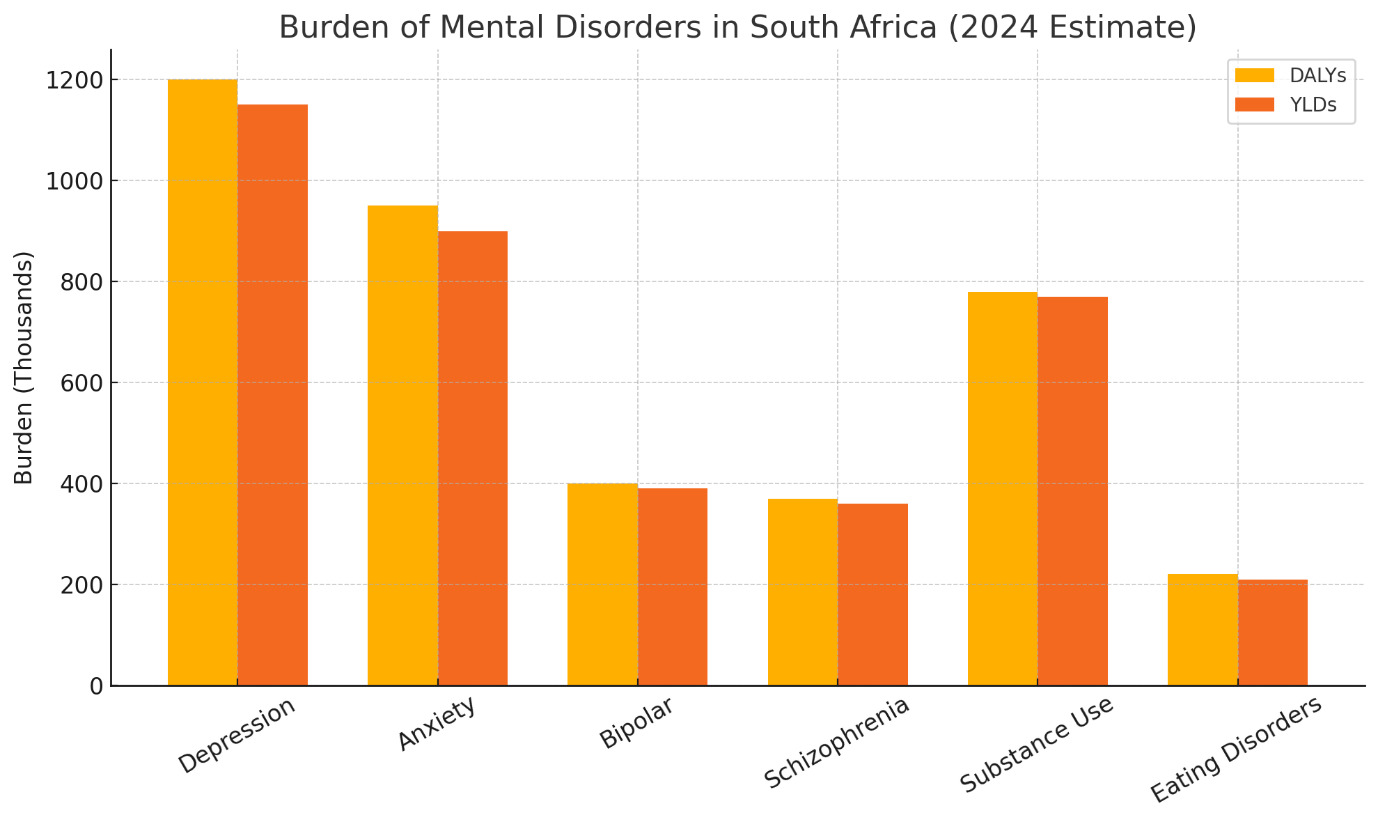
South Africa’s NCD burden mirrors these global trends, and the country’s efforts to integrate mental health and chronic disease management align with international best practices. Figure 3 illustrates that the highest burden of mental disorders in South Africa are depression and anxiety2 based on global modelling estimates; however, local mental health indicators show concerning gaps. The new treatment rate for mental disorders is negligible in most provinces, and the mental health separation rate varies widely, from 0.9 in Northern Cape to 18.0 in Gauteng, suggesting uneven access to in-patient mental health services. This is particularly concerning given that the Northern Cape recorded the highest rate of suicide at 6.6% in the StatsSA Causes of Death report.35
Cancer
According to GLOBOCAN,12 in South Africa, the age-standardised cancer incidence rate is 203.4 per 100 000 population, with prostate (62.0), breast (47.8), and cervical cancer (33.2) being among the most common. Notably, male cancer incidence (232.4) exceeds that of females (190.4), reflecting gendered risk exposures and screening disparities. National Cancer Registry (NCR) data for 2023 show lower incidence rates, which is likely to be due to under-reporting or differences in case capture, underscoring the need for improved cancer surveillance, as discussed in Ndlovu, et al. (2024).76
Diabetes and hypertension
Diabetes prevalence among adults aged 20–79 years is estimated at 7.2%,14 with detection and treatment rates remaining low. In 2023/24, only 87 792 new diabetes clients aged 45 years and older were recorded, and detection rates for adults aged 18 years and older remain below 0.6% in most provinces.39 Hypertension detection is slightly better, with 113 340 new cases among 18–44-year-olds and 168 956 among those aged 45 years and older, but detection rates still hover below 1% in most provinces. These trends suggest substantial under-diagnosis and missed opportunities for early intervention within routine systems in the public health sector. Strengthening surveillance, improving access to essential medicines, and addressing social determinants are critical components of the global response to NCDs (Table 11).
Nutrition
On a global and local level, nutrition is recognised as a cornerstone of health across the life course. The WHO reports that while global stunting rates among children under five have declined, over 148 million children remain stunted, with the highest burden being in South Asia and sub-Saharan Africa. Simultaneously, childhood overweight and obesity are rising rapidly, particularly in middle-income countries, reflecting a global nutrition transition marked by increased consumption of ultra-processed foods and sedentary lifestyles.78
Exclusive breastfeeding
Exclusive breastfeeding rates vary widely, with global averages at 48%, far below the 70% target set by the WHO. Micronutrient deficiencies, including iron, vitamin A and iodine, continue to affect billions, particularly women and children. In response, countries are adopting multisectoral strategies that integrate nutrition into health, education, and agriculture policies. Global initiatives such as the Scaling Up Nutrition (SUN) movement and the UN Decade of Action on Nutrition are driving co-ordinated action. South Africa’s dual burden of under-nutrition and obesity mirrors global trends, underscoring the need for comprehensive, equity-focused nutrition policies. Locally, exclusive breastfeeding rates remain suboptimal, with only 43.3% of infants being exclusively breastfed at the time of the third hexavalent vaccine dose in 2023/24. Provincial disparities are stark, where KwaZulu-Natal leads at 55.6%, while Limpopo (32.1%) and Mpumalanga (34.1%) fall well below the national average.39 These figures highlight missed opportunities for early-life nutrition and immune protection.
Obesity
Childhood and adolescent obesity and overweight rates are rising in South Africa. Among children aged 5–9 years, 6.9% are obese and 19.5% are overweight, while among adolescents aged 10–19, 7.2% are obese and 21.8% are overweight.78 Gender disparities are notable, where 9.6% of adolescent girls are obese compared to 4.9% of boys, and 29.4% of girls are overweight compared to 14.4% of boys. These trends reflect dietary shifts, sedentary lifestyles, and socio-environmental influences, and signal future increases in diabetes, cardiovascular disease, and other NCDs.79
Among adults, the situation is even more concerning. Over half (55%) of adults aged 18 and older are overweight, with 30.8% classified as obese. The gender gap is pronounced, with 71.3% of women being overweight or obese compared to 37.2% of men in South Africa. Conversely, underweight remains a concern for 5.2% of adults, particularly among men (8.2%), reflecting a dual burden of malnutrition.7 Stunting among children under five remains high at 24.4%, indicating chronic under-nutrition and its long-term developmental consequences.80
Micronutrients
Micronutrient deficiencies also persist. Vitamin A supplementation coverage for children aged 12–59 months was 69.5% nationally in 2023/24, with wide provincial variation from 85.7% in KwaZulu-Natal to just 47.9% in Northern Cape.39 These gaps suggest uneven implementation of child health programmes and highlight the need for strengthened outreach and supply-chain management.
There is a need for a comprehensive, life-course approach that includes promoting breastfeeding, improving school-based nutrition and physical activity programmes, scaling up community-based screening and counselling, and addressing the social determinants of health that drive poor nutrition and lifestyle risk factors. Without decisive action, the rising tide of NCDs threatens to overwhelm the health system and reverse gains in life expectancy and quality of life.81
Nutrition and mental health
Recent South African studies reveal a strong link between malnutrition and mental health in children and adolescents. Food insecurity remains a major issue, with children in food-insecure households having over 60% higher odds of anxiety and depression compared to those in food-secure homes.82,83 Under-nutrition marked by stunting and micronutrient deficiencies adversely affects cognitive development and school readiness, especially in female-headed or informal households where food insecurity is more prevalent.84 Concurrently, rising adolescent overweight and obesity were found to be linked to increased depression and low self-esteem, particularly among girls.85 This dual burden of malnutrition highlights the need for integrated policies addressing both nutrition and mental health to improve children’s lifelong well-being (Table 12).
Injuries and risk behaviours
Injuries and risk behaviours remain leading contributors to premature mortality and disability. The global estimates state that over 1.3 million people die annually from road traffic injuries, with low- and middle-income countries accounting for more than 90% of these deaths. Homicide rates are highest in Latin America and parts of sub-Saharan Africa, reflecting the intersection of socio-economic inequality, urban violence, and weak law enforcement. Substance use, particularly alcohol and tobacco, continues to drive a significant share of the global disease burden.86 The Global Burden of Disease Study attributes over 7 million deaths annually to tobacco use, and 3 million to harmful alcohol consumption. Among adolescents, early initiation of smoking, alcohol and drug use is a growing concern worldwide, with rising trends in e-cigarette use and synthetic drugs. Countries such as Iceland87 and Australia88 have implemented successful school- and community-based prevention programmes, offering models for reducing youth risk behaviours. Globally, there is increasing recognition of the need for integrated, multisectoral strategies that combine public health, education, law enforcement, and social services to address the root causes of injuries and risk behaviours.
Interpersonal violence and road traffic fatalities
The data reflected in Table 13 highlight the persistent burden of violence, road traffic injuries, and substance use. The national homicide mortality rate remains alarmingly high at 33.8 per 100 000 population,67 positioning South Africa among the countries with the highest levels of interpersonal violence globally. Road traffic fatalities also remain a major concern, with 10 339 deaths recorded in 2024 which was an increase from 10 180 in 2023, despite a slight decline in the rate per 100 000 population from 19.4 to 19.3.29 Provinces such as Gauteng (2 218 deaths) and KwaZulu-Natal (2 069) continue to bear the brunt of road-related mortality, reflecting both high vehicle density and systemic road safety challenges.
Substance abuse
Substance use data from SACENDU Phase 5431 further underscore the scale of the problem. In the first half of 2024 alone, Gauteng recorded 4 782 admissions for alcohol and drug abuse, followed by the Western Cape (1 727) and KwaZulu-Natal (872). Among individuals under 19, cannabis dominates as the primary drug of abuse, accounting for up to 84% of cases in some provinces, while alcohol, mandrax and methamphetamine also feature prominently.31 These patterns point to the urgent need for targeted prevention and treatment strategies, particularly for adolescents.
Prevalence of smoking and alcohol consumption
Tobacco use remains widespread, with 20.2% of individuals aged 15 and older in South Africa reporting smoking in 2022.6 The gender disparity is stark: 35.1% of adult males smoke compared to just 6.5% of females. Alarmingly, smoking prevalence among South African children aged 10–14 years is also high at 21.3% for boys and 17.7% for girls, suggesting early initiation and inadequate enforcement of tobacco control measures.
Alcohol consumption per capita among those aged 15 years and older stands at 7.8 litres annually,7 reinforcing South Africa’s classification as a high-consumption country.89 This, combined with the high rates of alcohol-related admissions and road fatalities, signals the need for stronger policy interventions, including regulation, taxation, and public education.
Infectious diseases
Despite advances in prevention, surveillance, diagnostics, treatment and control, infectious diseases continue to pose significant public health challenges. The resurgence of diseases like cholera and measles in various regions underscores the fragility of health systems and the importance of sustained immunisation and water sanitation efforts.90 The WHO estimates that over 1.3 billion people remain at risk of neglected tropical diseases, with climate change and urbanisation contributing to the spread of vector-borne illnesses such as malaria and dengue. Cross-border mobility and global trade have also heightened the risk of rapid disease transmission, necessitating stronger international collaboration and early warning systems.91
Disease outbreaks like cholera, measles and malaria can have significant psychosocial impacts on individuals and communities, including increased anxiety, grief and stigma, which can disrupt social structures and mental well-being. Furthermore, healthcare workers face unique challenges and potential psychological distress during outbreaks, highlighting the need for comprehensive mental health support.92
Cholera
Despite significant progress in disease surveillance and control, South Africa continues to face recurrent outbreaks and persistent burdens from key infectious diseases. Cholera re-emerged as a public health concern in 2023, with 1 395 reported cases and a case fatality rate of 3.4% which is well above the WHO threshold of 1%.93 The 47 reported deaths underscore gaps in water, sanitation and rapid response systems, particularly in vulnerable communities.
Measles
Measles outbreaks also persisted, with 1 029 laboratory-confirmed cases in 2023 and 833 in 2024.94 Gauteng and Mpumalanga reported the highest case counts, suggesting gaps in immunisation coverage and outbreak containment. The increase in cases in provinces like KwaZulu-Natal and Western Cape between 2023 and 2024 signals the need for intensified catch-up campaigns and improved vaccine confidence.
Malaria
Malaria remains endemic in several provinces, with 4 384 cases reported by the NICD in 2023,27 and a higher estimate of 5 291 cases from WHO sources.22 The rise in malaria cases in Botswana, Eswatini and South Africa is likely to be driven by several factors, such as difficulties in maintaining high coverage of vector control measures, increased cross-border movement (particularly between Mozambique and Eswatini and South Africa for economic reasons), and weaknesses in surveillance systems. Other contributing factors include the influence of climate change disasters on malaria transmission patterns, under-reporting, and delays in case detection, investigation and response in 2022.22 Limpopo (2 137 cases) and Mpumalanga (635) continue to bear the brunt of transmission, while Gauteng (830) and KwaZulu-Natal (332) reflect increasing urban and peri-urban exposure. The 113 malaria-related deaths in 2023 highlight the need for sustained vector control, early diagnosis, and treatment access, especially in border regions and mobile populations.22
These trends reflect the ongoing vulnerability of South Africa’s population to preventable infectious diseases. Strengthening early warning systems, improving outbreak preparedness, and ensuring equitable access to vaccines and treatment are critical. Moreover, integrating infectious disease surveillance with broader health system strengthening, particularly in PHC and community outreach, will be essential to mitigate future outbreaks and reduce mortality.95
Outbreaks and the mental health system gap
Infectious disease outbreaks such as cholera, measles and malaria not only cause physical harm but also trigger significant psychological and social impacts including heightened anxiety, fear and stress, as seen during and after COVID-19.96,97 These effects are intensified by South Africa’s under-resourced mental health system where nationally, about 5% of the health budget goes to mental health and only ~25% of people who need care receive it,98,99 despite policy commitments in the National Mental Health Policy Framework and Strategic Plan 2023–2030 (NMHPFSP).9 High burdens of depression, anxiety and psychological distress among people living with HIV compound vulnerability during outbreaks (Table 14).100
Health facilities
Health facility performance is a critical determinant of health system effectiveness. Countries with well-distributed and adequately resourced health infrastructure tend to achieve better health outcomes.101 The WHO recommends optimal bed occupancy rates range between 75% and 85%, balancing efficiency with surge capacity. Many high-income countries maintain average lengths of stay that are shorter than six days through efficient care co-ordination and post-discharge support. In contrast, low- and middle-income countries often face challenges such as under-utilisation in rural areas and overcrowding in urban centres.102
Globally, nurse workloads and facility standards are key indicators of service quality, with the WHO advocating for workload-sensitive staffing models and universal adoption of quality improvement frameworks. South Africa’s performance reflects global strengths, such as high medicine availability, as well as challenges, including regional disparities in infrastructure and staffing. Lessons from countries that have successfully decentralised services and invested in PHC revitalisation may offer valuable insights for strengthening South Africa’s health facility performance.
Psychiatric health facilities
South Africa’s mental healthcare system leans heavily on specialised psychiatric hospitals for in-patient care, with a smaller proportion of services offered at general hospitals.98 The NMPHFSP does, however, outline plans to downscale specialist mental healthcare facilities and upscale community-based care facilities, in line with WHO recommendations.103
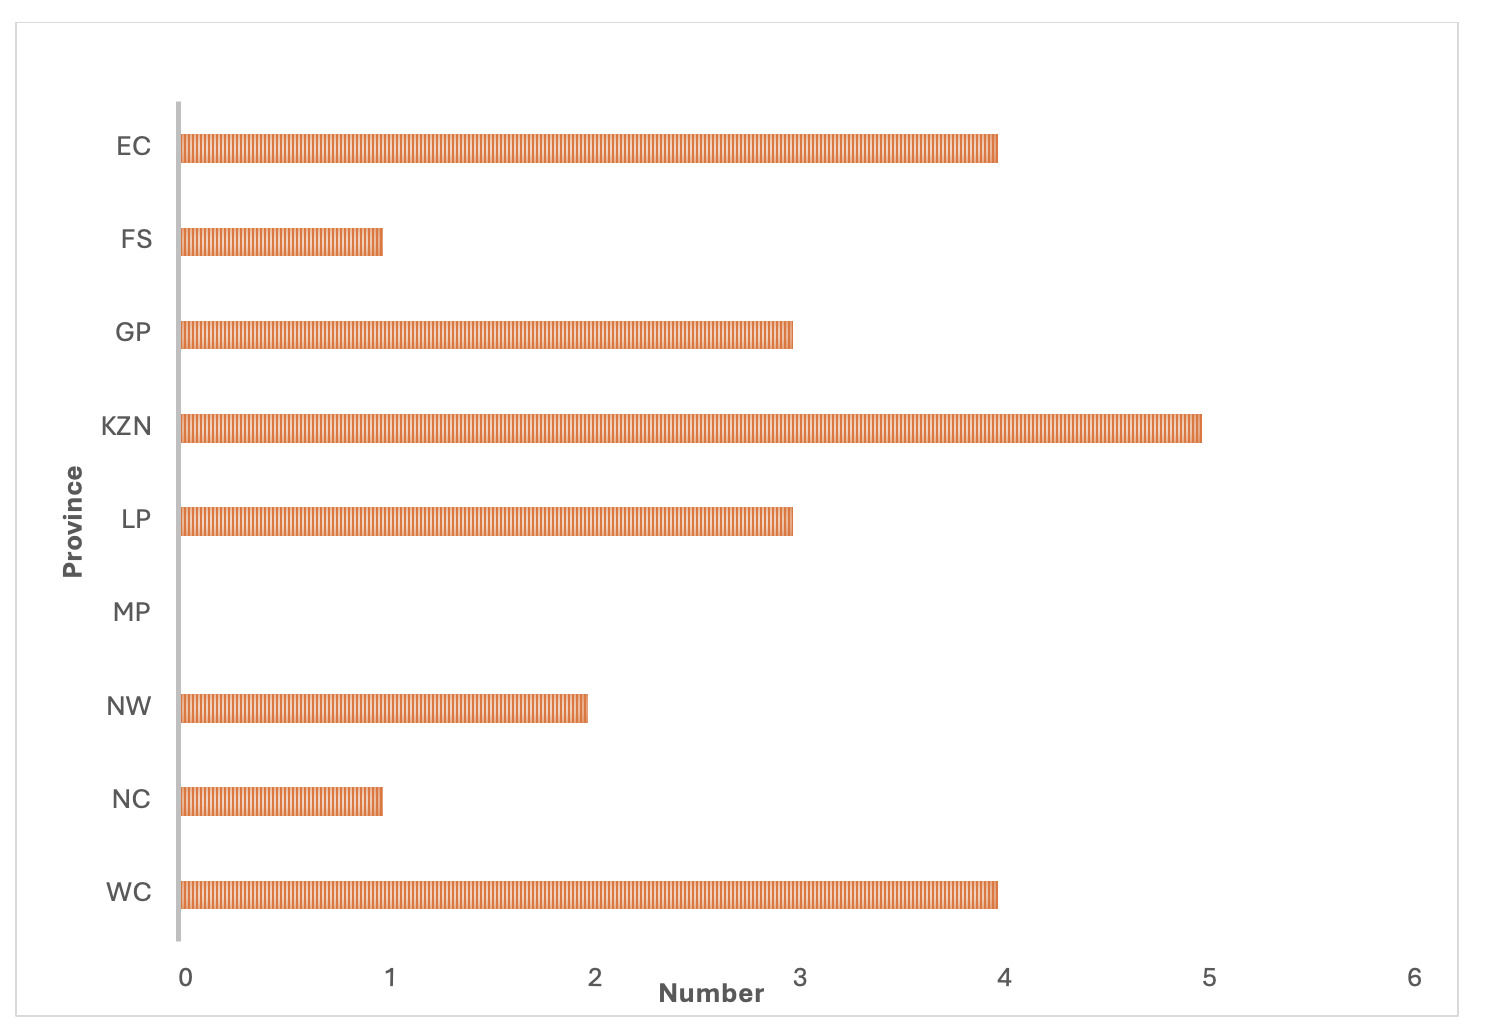
Figure 4 shows the distribution of the 23 specialised psychiatric hospitals within the public sector in South Africa. The distribution of psychiatric facilities across the country reveals a concentration in urban and peri-urban areas, with notable clusters in provinces such as Gauteng, KwaZulu-Natal, and the Western Cape. These provinces host multiple specialised psychiatric hospitals, reflecting their higher population densities and more developed healthcare infrastructure. In contrast, provinces like Mpumalanga have no facilities, which may indicate limited access to specialised mental health services in more rural or sparsely populated regions. This uneven distribution underscores the need for strategic planning to improve equitable access to psychiatric care across all provinces, particularly in under-served areas.
Average length of stay
The performance of South Africa’s health service infrastructure, as reflected in Table 15, reveals a system under pressure but showing signs of resilience and responsiveness. The national average length of stay (ALOS) across all hospitals was 6.4 days, with Gauteng (7.5) and Eastern Cape (7.0) reporting the longest stays which potentially reflects higher patient acuity or delayed discharges. In district hospitals, the ALOS was shorter at 4.5 days, with Free State (3.4) and Northern Cape (3.4) at the lower end, suggesting more efficient throughput or lower case complexity.39
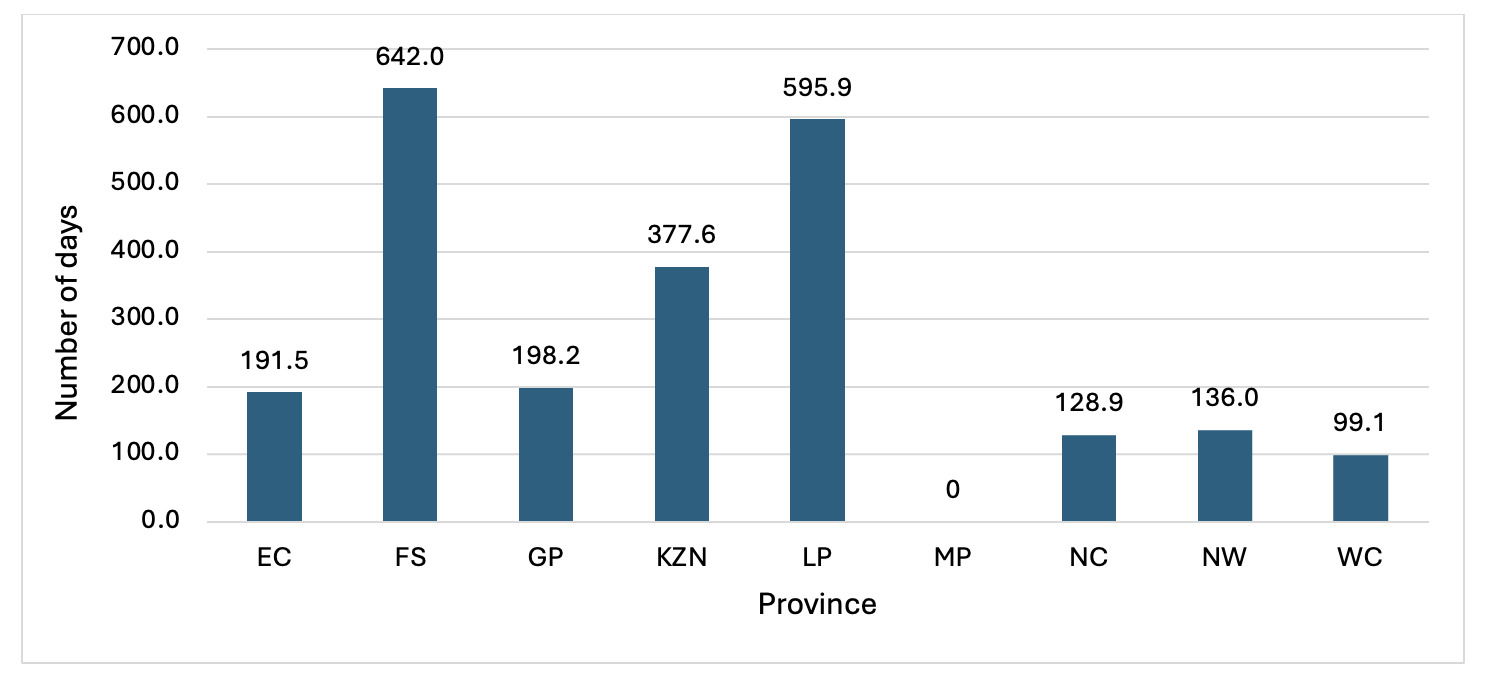
The ALOS in specialised psychiatric hospitals across South Africa reflects considerable variation (Figure 5), highlighting differences in provincial mental health service delivery. While the national average is just under 183 days, some provinces, particularly the Free State and Limpopo, show markedly longer hospital stays, suggesting a predominance of long-term admissions or systemic factors affecting discharge. In contrast, provinces such as the Western Cape and Northern Cape report much shorter stays, possibly due to more community-based care options or higher patient turnover. These variations may be influenced by differences in bed availability, referral pathways, and the extent of mental health integration into primary and community care services. Addressing these disparities is important for ensuring equitable, efficient, and patient-centred psychiatric care nationwide.103

Bed utilisation
Bed utilisation rates offer further insight into system capacity. The national in-patient bed utilisation rate as recorded in the public health routine system was 69.4%, with Western Cape (86.7%) and Gauteng (78.7%) operating near or above optimal thresholds, while Eastern Cape (59.1%) and KwaZulu-Natal (62.2%) reported under-utilisation. District hospital bed utilisation was lower at 61.4% nationally, with Western Cape again leading at 86.9%.39 These figures suggest regional imbalances in demand and capacity, with implications for referral patterns and resource allocation.
Primary Health Care utilisation
Primary Health Care indicators show mixed performance. The PHC utilisation rate was 1.7 visits per person per year nationally, below the recommended benchmark of 3.0. Utilisation was highest in Eastern Cape (2.1) and Limpopo (2.0), and lowest in Gauteng (1.2), suggesting access barriers or service delivery gaps in urban areas. Among children under five, the utilisation rate was higher at 3.0, with Limpopo (3.7) and Western Cape (3.2) performing well.
In-patient mortality
In-patient mortality remains a concern, with a national crude death rate of 4.7%. Eastern Cape (6.3%) and Gauteng (5.4%) reported the highest rates, while Western Cape had the lowest at 3.4%. The total number of in-patient deaths exceeded 165 000, with district hospitals accounting for nearly 44% of these. Notably, national central hospitals in Gauteng and Western Cape reported high mortality volumes, reflecting their role in managing complex cases.
Professional Nurse workloads
The PHC Professional Nurse workload averaged 23.3 patients per day, with the highest burdens in Eastern Cape (27.3) and KwaZulu-Natal (26.9), raising concerns about staff burnout and quality of care. Encouragingly, 78% of clinics nationally met the Ideal Clinic standards, with KwaZulu-Natal, North West, and Western Cape achieving 97% compliance. However, Limpopo (42%) and Northern Cape (35%) lag significantly, highlighting the need for targeted quality improvement initiatives.
Availability of medicines
Medicine availability remains strong, with 89% of Ideal Clinics reporting 90% tracer medicine availability. This is a positive sign of supply-chain stability, although continued vigilance is needed to prevent stock-outs, particularly in rural provinces.
Overall, the health service indicators reflect a health system that is functional but uneven. Addressing disparities in infrastructure, staffing and service quality will be essential to achieving equitable access and improving health outcomes across provinces.
Health personnel
The health workforce crisis remains a major barrier to achieving universal health coverage where there is a projected shortfall of 10 million health workers by 2030, primarily in low- and lower-middle-income countries.104 Many nations face similar challenges to South Africa, including maldistribution of health professionals, urban─rural disparities, and shortages in specialised cadres such as mental health professionals. High-income countries often rely on international recruitment to fill gaps, which can exacerbate workforce shortages in source countries. Task-shifting and Community Health Worker programmes have been adopted globally to address these gaps, with countries like Ethiopia, Brazil, and India demonstrating scalable models.105
Strengthening health workforce information systems, improving retention strategies, and aligning training with population health needs are global priorities echoed in the WHO Global Strategy on Human Resources for Health.106 A closer look at South Africa’s human resources for health reveals a system marked by both progress and persistent inequities. Rather than a uniform distribution, the data show significant provincial disparities in the availability of key health professionals. For example, the national average of medical practitioners in the public sector stands at 35.6 per 100 000 population, but this ranges from 28.0 in Free State to 40.7 in Northern Cape.28
Human resources for mental health
South Africa faces a persistent and inequitable shortage of human resources for mental health across disciplines and levels of care. There is a severe shortage of trained mental healthcare providers, with considerable variation between provinces (Figure 6).107 Psychologists, for instance, are available at just 1.5 per 100 000 nationally in the public sector, with even lower densities in provinces such as the Free State (0.9) and Mpumalanga (0.9), reflecting critical shortages in specialised and allied health professions.107 The WHO Mental Health Atlas estimates for South Africa are only 1.59 psychiatrists, 15.36 psychologists and 86.23 social workers per 100 000 overall, with just 0.11 child and adolescent psychiatrists per 100 000.16 These figures mask deep public–private and urban–rural disparities: approximately 80% of psychiatrists work in the private health sector, and the vast majority are based in urban areas in just two provinces: Gauteng and the Western Cape.108 In the public sector, which serves most of the population, psychiatrist density is only 0.38 per 100 000 compared to 4.98 per 100 000 in the private sector.109 The NMHPFSP acknowledges “major shortfalls in human resources” and reports densities among the uninsured population of just 0.31 psychiatrists and 0.97 psychologists per 100 000.9 These shortages contribute to hospital-centric models of care, limited community-based services, and significant service bottlenecks, with the most pronounced deficits to be found in rural areas and in child and adolescent mental health. Addressing these gaps requires accelerated workforce expansion, strategic redistribution, and supported task-sharing to extend equitable mental health coverage nationwide.

To address the shortage of specialist mental healthcare providers, South Africa has adopted task-sharing models in line with WHO recommendations. Task-sharing refers to the structured redistribution of responsibilities traditionally performed by specialist mental health professionals, such as psychiatrists and psychologists, to non-specialist health workers. This approach aims to expand access to mental health services, particularly in resource-constrained settings like South Africa.107
Nurses
Nursing remains the backbone of the health system, with Professional Nurses at 141.3 per 100 000 nationally. However, the distribution again varies widely from 91.8 in Western Cape to 187.5 in Eastern Cape. The density of Enrolled Nurses and Nursing Assistants also reflects this imbalance, with Limpopo and Eastern Cape reporting the highest ratios. There is a need for targeted workforce planning and retention strategies, particularly in under-served provinces.
Medical doctors
The gap between registered and employed professionals is another concern. For example, while 53 408 medical practitioners are registered with the Health Professions Council of South Africa (HPCSA)24 (as of October 2024), only 16 493 are employed in the public sector. This suggests that a significant proportion of the workforce is either in the private sector or not actively practising, raising questions about workforce absorption and distribution.
To address these challenges, South Africa must strengthen its Human Resources for Health (HRH) strategy through improved forecasting, equitable deployment, and incentives for rural service. The 2030 National Human Resources for Health Strategy outlines many of these priorities, but implementation remains uneven. Without a concerted effort to align workforce supply with population health needs, the goal of universal health coverage will remain out of reach.
Health financing
Many low- and middle-income countries continue to struggle with inadequate public health spending, high out-of-pocket expenditures, and limited financial risk protection. While South Africa has met the Abuja target of allocating at least 15% of government expenditure to health, most African countries fall short, with the regional average hovering around 9%. Globally, the average government health expenditure as a share of GDP is 6.6%, with high-income countries spending over 8% and low-income countries often below 2%. Out-of-pocket spending remains a major barrier to access in many regions, accounting for over 40% of total health expenditure in some countries, leading to catastrophic health costs and impoverishment.20
Mental health programme expenditure
Mental healthcare spending in South Africa is estimated to account for 5% of the total public health budget. However, six out of nine provinces allocate less than this benchmark.98,103 In South Africa, mental healthcare services are predominantly concentrated at the top of the healthcare system, mainly within secondary hospitals and specialist facilities.107 An estimated 86% of the mental health budget is reportedly spent on in-patient care, with nearly half of that going to tertiary hospitals.98 This leaves significantly fewer resources available at other levels of care, especially within community-based services ─ thus going against the WHO’s optimal mix of services pyramid, which recommends integrating mental health into primary health care and limiting the number of psychiatric hospitals or specialist services providing long-term chronic care.107
An analysis of provincial health budget allocations to mental health care showed that Gauteng (6.2%), KwaZulu-Natal (5.0%), and the Western Cape (7.5%) allocate a higher-than-average share, indicating stronger prioritisation of mental health. In contrast, provinces such as the Eastern Cape (2.8%), Limpopo (2.6%), and the North West (3.1%) dedicate a smaller proportion of their budgets to this area.109 In their analysis of health expenditure on mental health programmes across provinces, Docrat, et al. (2019)109 highlighted that PHC receives the lowest contribution from the total mental health budget, followed by district hospitals. The PHC expenditure also includes the costs of medication for people living with severe mental health conditions who are discharged from hospitals and community health centres.107
Key recommendations for improving mental health financing emphasise optimising the use of existing resources. This includes aligning human resource allocations and budgets with actual service demands; restructuring hospital platforms to support shorter in-patient stays and expanded out-patient care; and redirecting funds to fully operationalise under-utilised facilities rather than investing in new infrastructure.98
Health programmes expenditure
The percentage of expenditure per programme by province, as illustrated in Figure 7, shows that District Health Services saw increased prioritisation in provinces such as KwaZulu-Natal and the Eastern Cape, suggesting an emphasis on PHC and community-level service delivery. Although there was a slight decline, Central Hospital Services expenditure has dominated in provinces like Free State, Mpumalanga and Limpopo, indicating continued reliance on tertiary care infrastructure in these regions. Overall, Health Facilities Management, Health Sciences and Training, and Emergency Health Services remained relatively stable across provinces, showing consistent investment in infrastructure, workforce development, and emergency response.

Medical scheme coverage
Medical scheme coverage remains highly unequal. Nationally, only 14.7% of the population is covered by medical schemes, with Gauteng (39%) and Western Cape (15%) far exceeding provinces like Northern Cape (2%) and Free State (5%). This entrenches a two-tiered health system, where access to private care is concentrated among wealthier, urban populations. The pensioner ratio within medical schemes, which is 9.4% overall and 11.4% among females, also highlights the ageing of the insured population, with implications for scheme sustainability and benefit design.23
Expenditure per patient day equivalent
There are still persistent disparities in health spending across provinces and between insured and uninsured populations, as shown in Table 18. Nationally, the average expenditure per patient day equivalent (PDE) in district hospitals was R3 754, with Gauteng (R4 493) and North West (R4 683) spending significantly above the national average, while Free State (R3 049) and Western Cape (R3 193) reported the lowest.26 These differences may reflect variations in input costs, service delivery models, and efficiency, but also raise concerns about equity and resource allocation.
District Health Services expenditure
Per capita expenditure on District Health Services for the uninsured population averaged R2 355 nationally, with Limpopo (R2 788) and KwaZulu-Natal (R2 644) at the higher end, and Gauteng (R1 834) at the lowest despite its large uninsured population.26 This suggests a potential mismatch between population need and financial allocation. Similarly, PHC expenditure per capita ranged from R1 305 in Limpopo to R1 676 in KwaZulu-Natal, while PHC expenditure per headcount was highest in Gauteng (R882.6) and lowest in Limpopo (R599.6), indicating differences in service utilisation and cost structures.
Official development assistance
South Africa received just USD1.50 per capita in official development assistance (ODA) for medical research and basic health in 2022, underscoring the need for greater domestic investment in health system strengthening. While ODA plays a supplementary role, reliance on external funding is not sustainable for core service delivery.7
There is an urgent need for more equitable and efficient health financing. The National Health Insurance (NHI) policy aims to address these disparities, but its success will depend on robust fiscal planning, improved public financial management, and transparent allocation mechanisms. Strengthening provincial budgeting processes and aligning expenditure with population health needs are essential steps towards universal health coverage.110 Furthermore, in alignment with the recommendations of the National Mental Health Investment Case,111 it is essential to establish dedicated mental health directorates in all nine provinces. Building capacity to effectively plan, manage and evaluate integrated mental health services is also critical to strengthening the system and ensuring sustainable delivery.
Conclusion and recommendations
Globally, the integration of mental health into broader health and development agendas is gaining momentum. Countries are increasingly recognising the importance of mental health data governance, standardised indicators, and community-based care models. The WHO Mental Health Atlas and the SDGs have catalysed efforts to embed mental health metrics into national surveillance systems. However, challenges persist worldwide, including fragmented data systems, under-reporting, and limited disaggregation by key equity dimensions.
Lessons from countries that have successfully harmonised mental health indicators and strengthened data infrastructure such as Chile,112 Thailand113 and the United Kingdom (NHS Mental Health datasets) offer valuable insights for South Africa. A global shift towards open data access, cross-sectoral collaboration, and investment in digital health platforms underscores the need for South Africa to align its mental health surveillance strategies with international best practices to ensure policy relevance and equitable service delivery.
In the context of mental health, the expansion of routine indicators, policy frameworks, and longitudinal cohort resources presents a significant opportunity for enhanced analysis and system insight. However, fragmented data governance, incomplete inclusion of community and informal care data, and limited disaggregation continue to hinder the generation of actionable evidence. Addressing these challenges will require the adoption of harmonised indicator standards, improved data quality assurance mechanisms, integration of mental health metrics into broader health and development monitoring systems, and greater transparency and accessibility to support effective policy translation.
The current distribution of mental health expenditure in South Africa reflects a system heavily skewed towards specialist and in-patient care, with limited investment in community and PHC services. This imbalance not only undermines equitable access to mental health care, but also diverges from global best practices advocating for integrated, community-based mental health care.