Introduction
Health data are only as valuable as the decisions they inform. A health system that collects information but does not use it to improve care, correct course, or share what works across its contexts is not fully realising the potential of its own evidence. This is the central idea behind a learning health system (LHS), it is one that continuously generates knowledge from its data and translates that knowledge into better practice.1 This edition of the South African Health Review (SAHR) is themed Learning Health Systems: Bridging Knowledge and Practice. This theme asks a fundamental question of South Africa’s health system: are we learning from what our data tells us? Learning, for the purposes of this paper, is a graded concept rather than a single state. Data availability, the identification of a signal, the interpretation of that signal, a documented system response, and demonstrated learning (a response followed by measurement of whether it worked) are related but distinct, and the evidence required for each differs. The criteria applied to these distinctions are set out in the Method section. This paper approaches that question from a practical starting point. It does not claim to resolve it, but it uses the country’s available secondary data to illuminate where progress is evident, where gaps persist, and crucially, where the data is absent or unreliable, which is its own important signal.
As in previous editions, this paper draws entirely on secondary data sourced from existing national information systems, published government reports, and credible surveillance platforms. These include: the National Department of Health’s (NDoH) District Health Information System (DHIS), currently implemented as a web-based DHIS2 platform commonly referred to as webDHIS; Statistics South Africa (Stats SA) surveys and population data; the South African Medical Research Council’s mortality and burden of disease reports; UNAIDS and national HIV estimates; National Treasury health expenditure data; and a range of disease-specific registers and reporting platforms.
The paper covers South Africa’s key health and related indicators across the following domains: demographic and socioeconomic context; burden of disease and health status; communicable diseases including HIV, tuberculosis, and other priority infections; maternal, newborn, and child health; non-communicable diseases (NCDs); health service coverage and utilisation; and health financing. Where data permit, indicators are disaggregated by province to allow for comparison and to surface the variation that exists within the country.
That provincial variation is itself a learning opportunity. South Africa’s nine provinces operate within the same national policy framework, yet their health outcomes and service performance differ, sometimes substantially. Where one province consistently outperforms others on a given indicator despite comparable resource levels, there is a question worth asking: what are they doing differently, and can it be adapted elsewhere? This paper cannot always answer that question, but it surfaces the data that makes the question possible.2
Throughout the paper, provincial variation is therefore treated as a signal requiring investigation rather than as direct evidence of better or poorer performance; differences in population structure, disease burden, migration, socioeconomic conditions, service configuration, data completeness and denominator construction may all contribute to the patterns observed.
Equally important is what a lack of data can tell us. Gaps in reporting completeness, inconsistencies across data sources, and indicators that are simply not being measured are not merely technical limitations, they reflect the extent to which South Africa’s health information systems are themselves still maturing. A system cannot learn from data it does not have. Where such gaps are identified in this paper, they are noted explicitly, in recognition that improving data quality is a prerequisite for the kind of evidence-based decision-making that an LHS demands.3
Taken together, the indicators presented in this paper offer a layered picture of South Africa’s health system, including its achievements, its persistent challenges, and the areas where knowledge and practice remain disconnected.
What is a learning health system?
The concept of an LHS describes a health system in which data, evidence and experience are systematically captured, analysed and fed back into decision-making, so that the routine operation of the system continuously generates improvement. The idea was first formalised in the United States by the Institute of Medicine, which described a system in which science, informatics, incentives and culture are aligned for continuous improvement and innovation.4 More recently, the World Health Organization’s Alliance for Health Policy and Systems Research (AHPSR) has adapted the concept for low- and middle-income country (LMIC) settings, framing learning as occurring at multiple levels: among individuals, teams, organisations, and across the system as a whole. It also emphasises that learning is not an automatic by-product of data collection, but a deliberate capability that must be built and governed.5
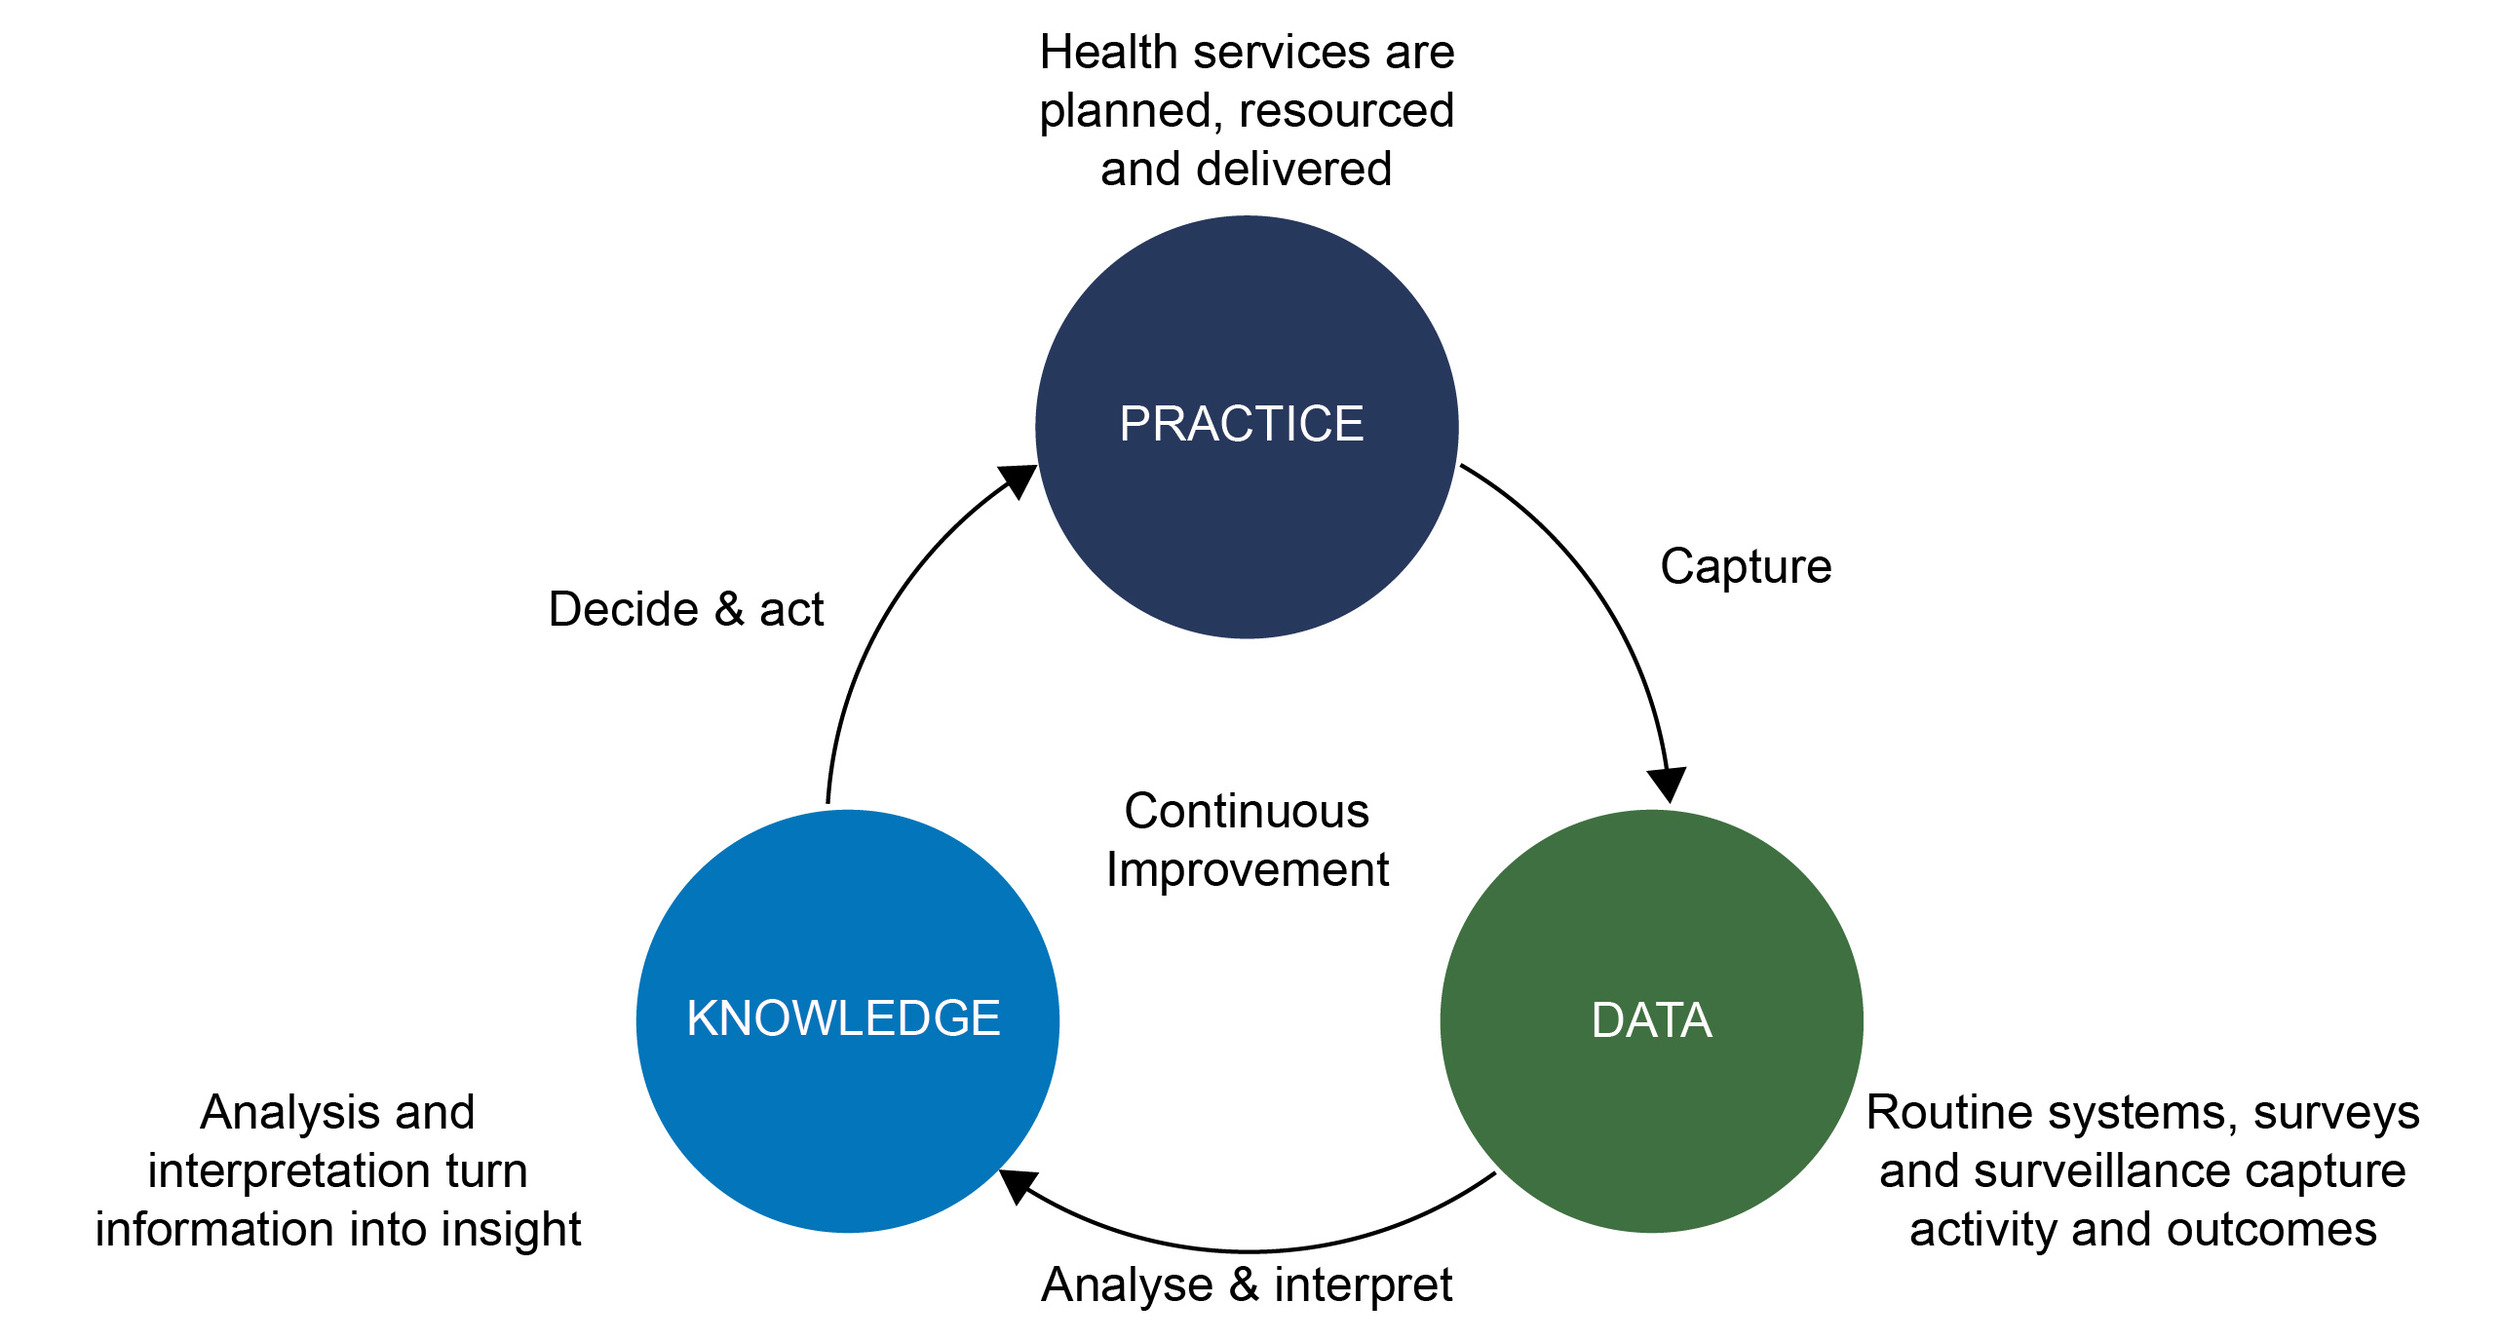
At its simplest, the LHS can be understood as a cycle with three arcs (Figure 1): from practice to data, as the system’s activities are captured through routine information systems, surveys and surveillance; from data to knowledge, as that information is analysed, interpreted and turned into insight; and from knowledge back to practice, as insight informs decisions that change how care is planned, resourced and delivered. The cycle then repeats, with new data revealing whether the change worked. A break in any arc stops the system from learning: data that is not collected cannot become knowledge; knowledge that is not acted upon cannot change practice; and practice that changes without measurement cannot be evaluated.
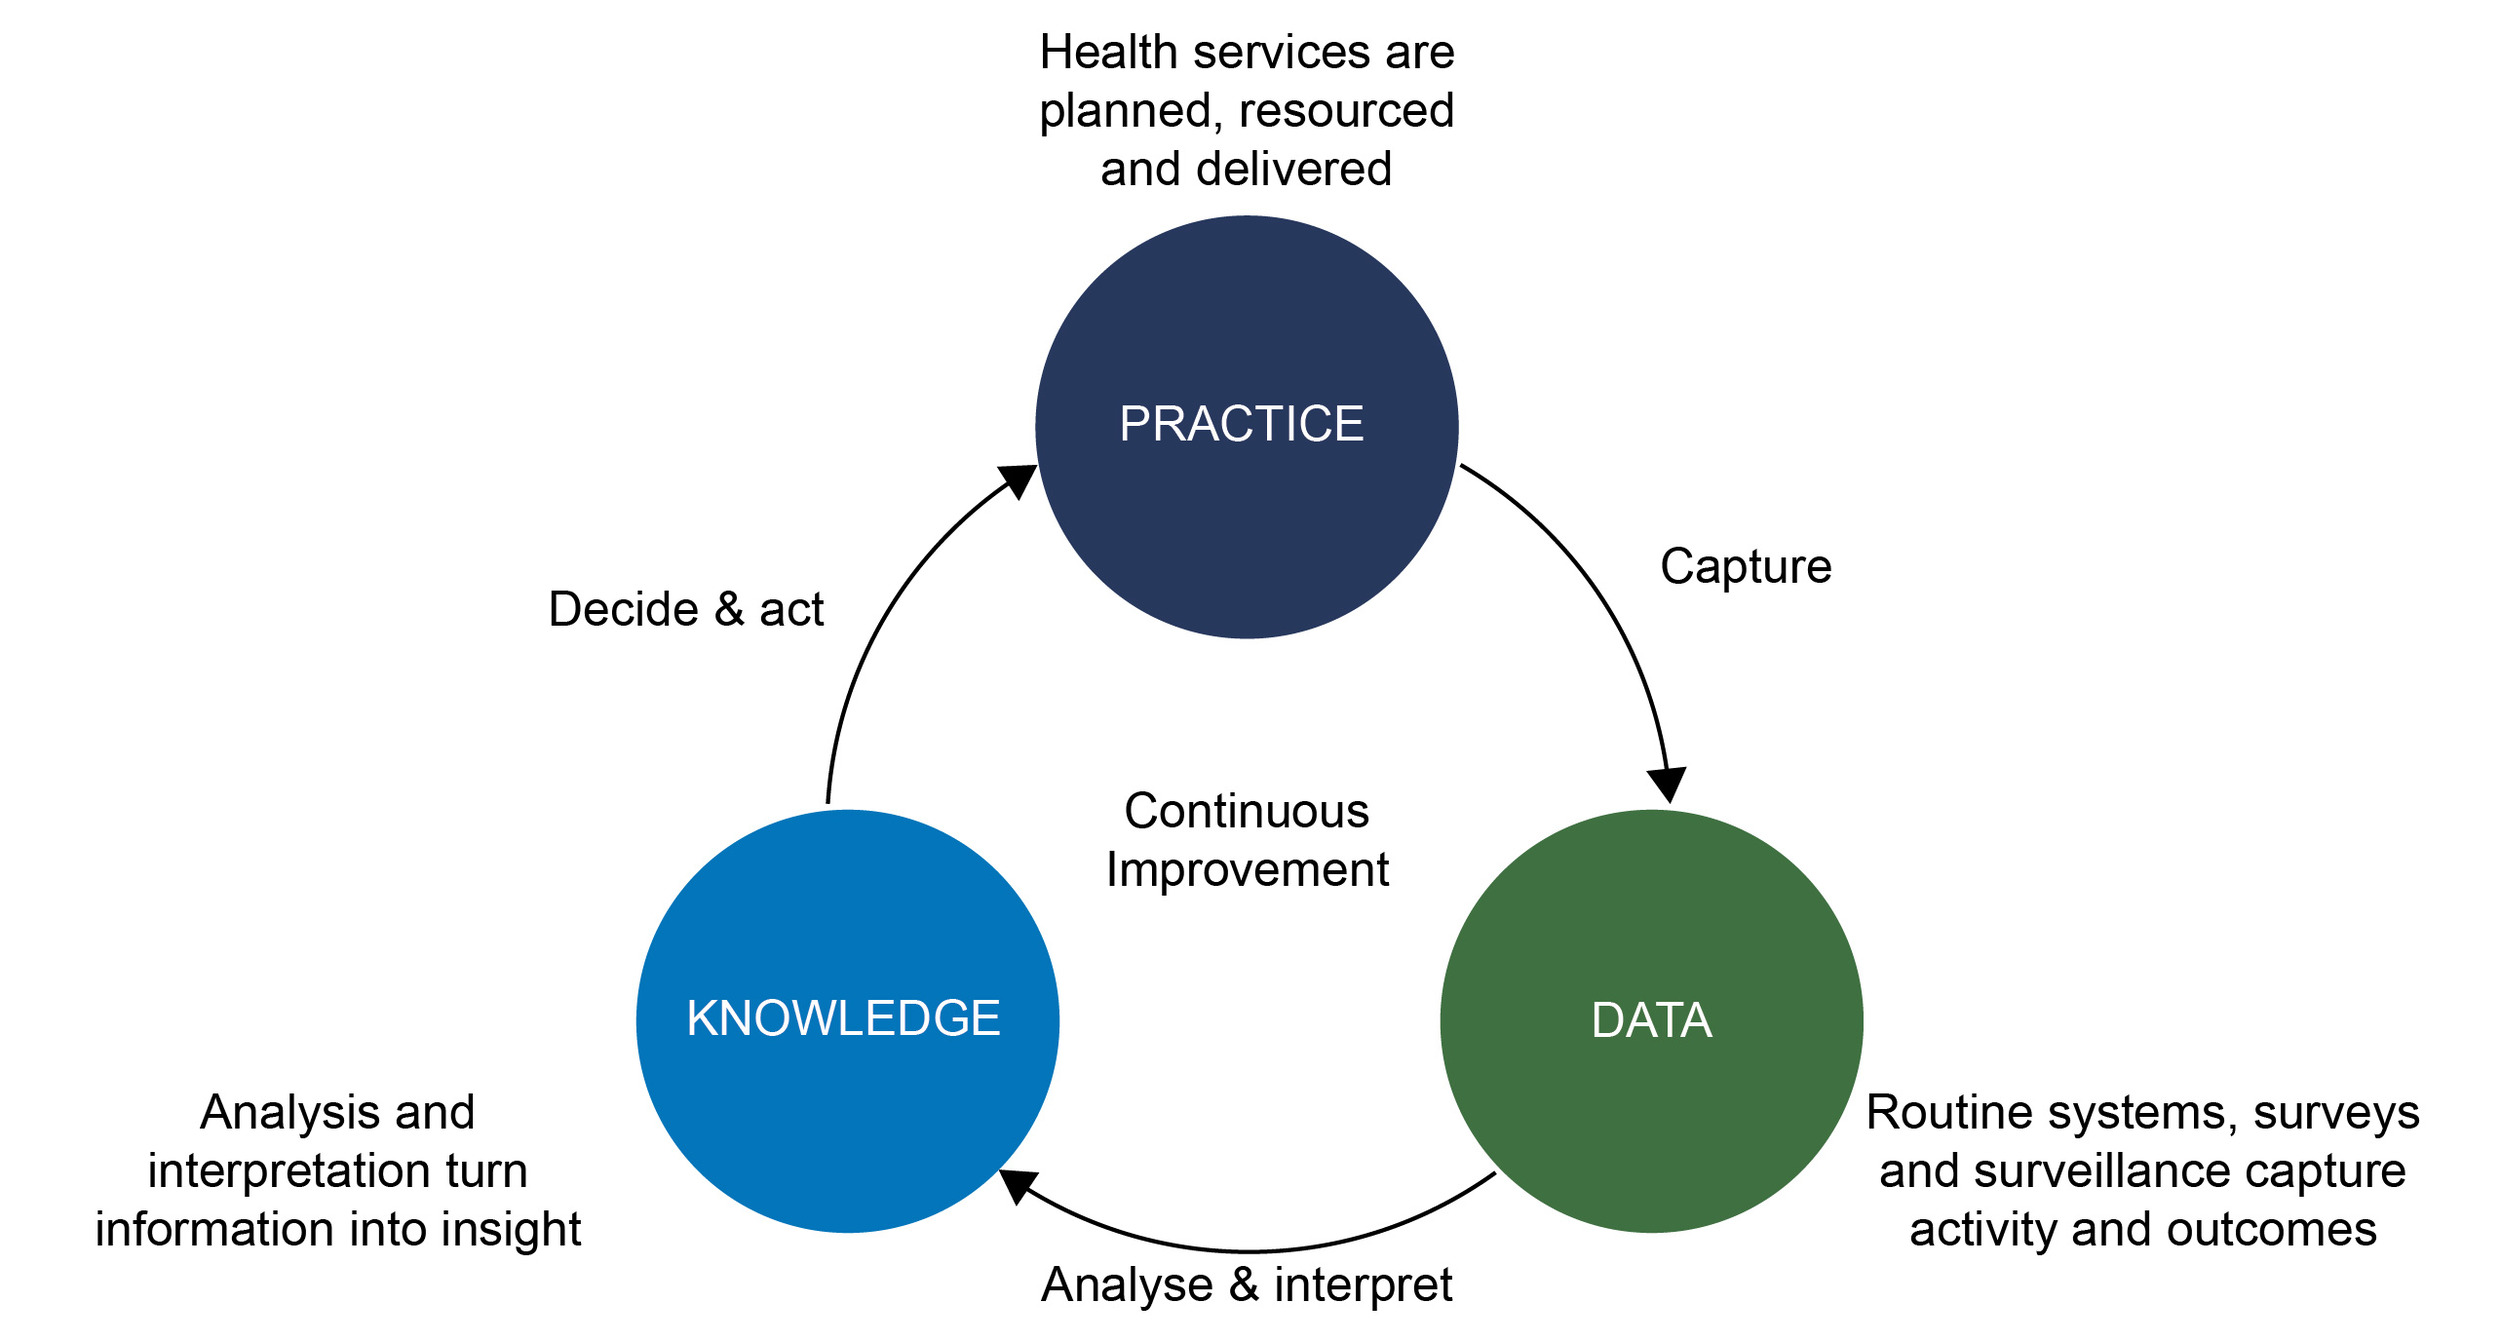
Figure 1.The LHS cycle: from practice to data, data to knowledge, and knowledge back to practice
This paper sits primarily on the first arc of that cycle. It cannot, from secondary data alone, determine whether knowledge is being translated into practice across South Africa’s health system. What it can do is assess the raw material of learning: whether the data exists, whether it can be trusted, whether it arrives in time to inform decisions, and whether it is disaggregated finely enough to reveal who is being left behind.
To make this lens explicit, each domain in this paper closes with a short ‘learning signals’ box structured around three questions:
-
What does the data reveal? In terms of the key trend, divergence or anomaly that decision-makers should notice.
-
Is the system responding? Where evidence exists, has the signal been translated into policy or practice? Where no such evidence was identified in the sources reviewed, this is stated explicitly.
-
What prevents learning? Where are the gaps in coverage, quality, timeliness or disaggregation that limit what the system can know about itself.
Read together across the paper, these boxes offer a domain-by-domain appraisal of South Africa’s readiness to function as an LHS. The analytical criteria applied to each of the three questions, and the distinction between a documented response and demonstrated learning, are described in the Method section, and the concluding synthesis draws the domain assessments together into a single comparative matrix.
Key data sources
The key new or updated sources relied upon, at both an international and national level, are shown in Box 1. Specific references and the current indicator definitions are provided in the data tables in the paper. Routine HIV and drug-susceptible TB service data reported here are drawn from the DHIS, into which TIER.Net (the Three Interlinked Electronic Register) data are imported; drug-resistant TB data are drawn from EDRWeb.
Box 1.Key data sources
| International |
South African |
- Air Quality Life Index 2025
- Global Burden of Disease (GBD)
- Global Cholera Dashboard
- Global Mind Project 2025
- Global Study on Homicide 2023
- Global Tuberculosis Report 2025
- Immunization Update 2025
- Levels and Trends in Child Mortality 2025
- Our World in Data
- State of the World’s Children 2025
- UNAIDS Data 2025
- WHO Global Health Observatory
- WHO Global Tobacco 2025
- World Health Statistics 2026
- World Malaria Report 2025
|
- Council for Medical Schemes Industry Report 2024
- District Health Information System (DHIS)
- Electronic Drug-Resistant Tuberculosis Register (EDRWeb)
- National Food and Nutrition Security Survey 2023
- National Institute for Communicable Diseases (NICD) Dashboard
- Personnel Administration System (PERSAL)
- Road Traffic Management Road Fatalities 2025
- South African Community Epidemiology Network on Drug Use (SACENDU)
- South African Nursing Council (SANC)
- South African Pharmacy Council (SAPC)
- Stats SA Cancer in South Africa 2024
- Stats SA General Household Survey (GHS) 2025
- Stats SA Labour Force Surveys 4th quarter of 2025
- Stats SA Mid-year population estimates 2025
- Stats SA Mortality and causes of death 2023
- Stats SA Recorded Live Births 2024
- THEMBISA v5.0 HIV and AIDS model
- Vulindlela (National Treasury)
|
Method
This paper follows the established approach of the Health and Related Indicators chapter: it synthesises secondary data only, with no primary data collection. Indicators were selected on four criteria: (1) continuity with previous editions of the paper, to preserve comparability over time; (2) relevance to the burden of disease and to national policy priorities, including the LHS theme of this edition; (3) availability of a current estimate, with the most recent available reference period used for each source and data extracted between July 2025 and June 2026; and (4) wherever possible, availability of provincial disaggregation. Sources were restricted to national information systems, official statistical releases, published surveillance outputs and recognised international estimation series, as listed in Box 1. Where several sources publish estimates for the same indicator, the estimate from the most direct measurement source was preferred in the narrative, and materially divergent estimates were retained and reported side-by-side rather than reconciled, because the divergence is itself informative about the state of the information system.
Throughout this paper, DHIS refers to the national routine health information system and its associated data series, while webDHIS refers specifically to the current web-based DHIS2 platform through which these data are captured, managed and accessed.
Denominators
Population denominators require particular care, and a caution stated here applies to every rate in this paper. The three-population series available for 2025 span 60.5 million (GBD),6 to 63.1 million (2025 Stats SA mid-year estimates),7 to 64.1 million (2025 GHS weighting),8 a spread of 3.6 million people. The mid-year estimates are produced annually using the cohort-component method within the Spectrum modelling system, incorporating the demographic impacts of HIV and COVID-19.6 The GHS, by contrast, is still weighted to benchmark population totals from the older 2017 series of mid-year estimates.8 Stats SA rebases survey weights only at roughly five-year intervals, an explicit trade-off between methodological currency and statistical stability, and the 2025 series incorporates Census 2022.6 Provincial discrepancies between the two Stats SA series, 1.3 million people for Gauteng and over half a million for the Eastern Cape, therefore reflect this deliberate benchmarking lag rather than error or disagreement about current dynamics. Stats SA further cautions that the mid-year series is revised retrospectively, so trends should be read from the complete revised series rather than compared across successive annual publications.7
The convention applied in this paper is as follows: DHIS-derived indicators use the denominators embedded in the routine system, which are drawn from the Stats SA mid-year estimate series, survey-based indicators use the survey’s own weighted denominators, and international estimation series use their own population bases. Rates from different denominator families are therefore not directly comparable, and small differences between them may be artefacts of benchmarking rather than real signals. None of this removes the practical consequence for indicator users: a coverage rate can shift by several percentage points purely through the choice of denominator, with no change in service delivery at all.
Most indicators are reproduced as published, and the source of each is identified in the data tables. Where the authors performed calculations, this is identifiable from the indicator definitions and includes: provincial crime rates per 100 000 population, calculated from South African Police Service counts using mid-year population estimates as denominators; combined public-private estimates in the maternal and child health sections, constructed by manually linking Council for Medical Schemes (CMS) beneficiary and claims data to public sector DHIS counts; and the cumulative reading of the HIV treatment cascade. Because the public and private sectors use different units, instruments and denominators, linked public-private estimates are approximations and are identified as such where they appear.
Implausible values and missing data
All tabulated values were screened for internal consistency, comparability with the previous year’s series and plausibility against known service configuration. Where a value failed these checks, the underlying records were interrogated before the text was finalised. Two corrections resulted: (1) a Free State bed-utilisation figure was traced to a single facility recorded with an impossible bed count and corrected to a value consistent with the 2023/24 series; and (2) a transposition of two provincial populations in the calculation of crime rates was detected and corrected. Where an implausible value could not be resolved against source data, such as the Western Cape’s reported antiretroviral effective coverage, it is flagged in the text and excluded from interpretation rather than silently repaired. Missing values are shown as blank cells in the tables and are not imputed.
Assessing the learning signals
Each domain closes with a learning signals box structured around three questions, assessed against explicit criteria:
-
What does the data reveal? is answered directly from the indicators: the trend, divergence or anomaly a decision-maker should notice.
-
Is the system responding? is answered affirmatively only where a documented action, meaning a policy change, programme adaptation, resource shift or published review process, can be linked to the specific signal in question. The mere existence of a programme, dashboard or monitoring system is not treated as evidence of response, and where no evidence of a response was identified in the sources reviewed, this is stated.
-
What prevents learning? identifies the gaps in coverage, quality, timeliness, integration or disaggregation that limit what the system can know about itself.
A documented response remains weaker evidence than demonstrated learning, which additionally requires subsequent measurement showing whether the response worked. The cross-domain synthesis near the end of the paper applies these distinctions comparatively across all fourteen domains, and its scoring criteria are those set out here.
Social determinants of health
Demographic
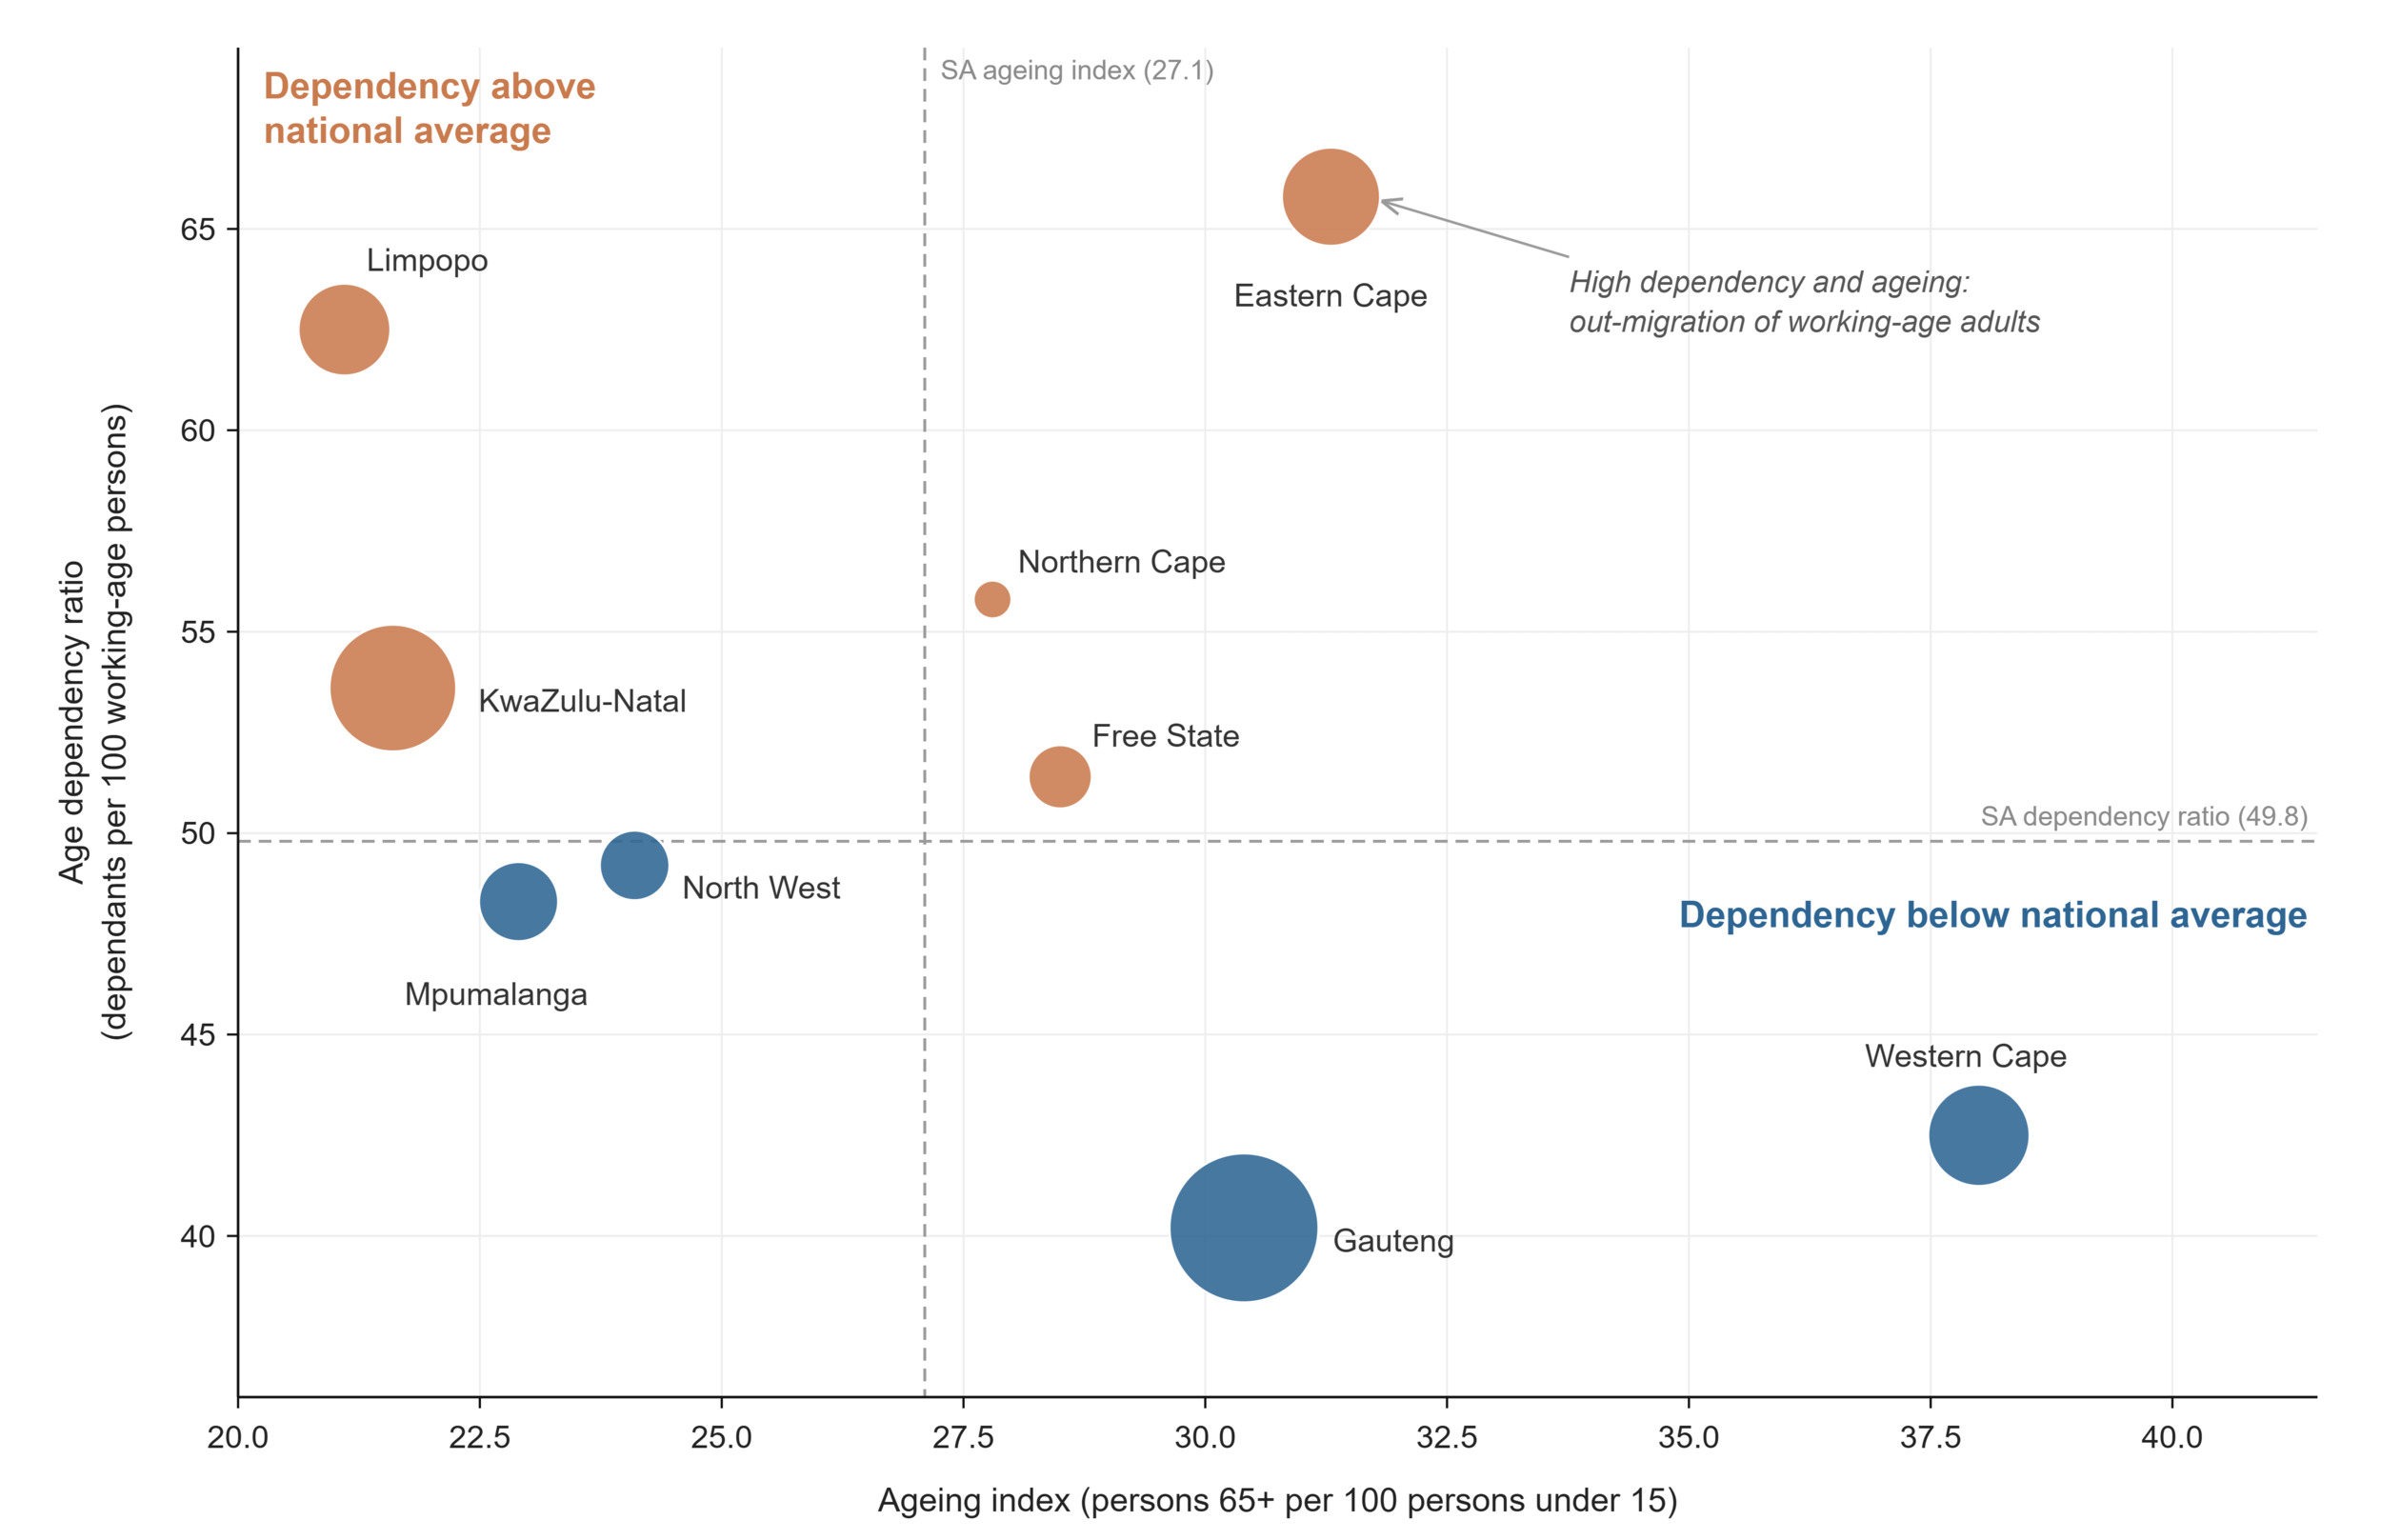
South Africa’s mid-year population was estimated at 63.1 million in 2025, growing at 1.23% per year.6 The country is midway through its demographic transition: the total fertility rate is estimated at 2.21 children per woman, just above replacement level,7,9 while 863 858 live births were registered in 2024.10 Life expectancy at birth stands at 66.9 years: 69.6 for females and 64.0 for males, continuing its recovery from the HIV-driven trough of the early 2000s, with the crude death rate at 8.8 deaths per 1 000 population.7 Nationally, the ageing index has reached 27.1 older persons (65+) for every 100 children under 15, signalling a population that is still young but ageing steadily. The 2025 mid-year population estimates show that persons aged 60 years and older increased from 7.7% of the total population in 2002 to 10.5% in 2025, and this share is projected to reach 16.2% by 2050. This rapid ageing poses complex challenges that differ markedly from those faced in many other countries (Table 1).11
The national figures conceal starkly divergent provincial trajectories (Figure 2). Gauteng holds a quarter of the national population (25.5%) at a density of 886 people per km2, compared with 3.7 per km2 in the Northern Cape.66 Decades of internal labour migration have sorted the provinces into distinct demographic profiles. The metropolitan, labour-receiving provinces combine below-average dependency ratios (Gauteng 40.2, Western Cape 42.5 dependants per 100 working-age persons) with the highest ageing indices (Western Cape 38.0, Gauteng 30.4). The labour-sending provinces remain younger, Limpopo’s ageing index is 21.1 and KwaZulu-Natal’s 21.6, but carry heavier dependency burdens (Limpopo 62.5).12 Decades of internal migration have contributed to distinct provincial demographic profiles. Census 2022 migration data identify Gauteng and the Western Cape as the principal net recipients of internal migrants, while the Eastern Cape and Limpopo recorded substantial net losses. The Eastern Cape’s combination of the country’s highest dependency ratio and second-highest ageing index is therefore consistent with sustained out-migration of working-age adults.12 The migration reading above is an interpretation rather than a demonstrated causal relationship since fertility and mortality differentials also shape provincial age structures, and the relative contribution of migration cannot be isolated from these data.
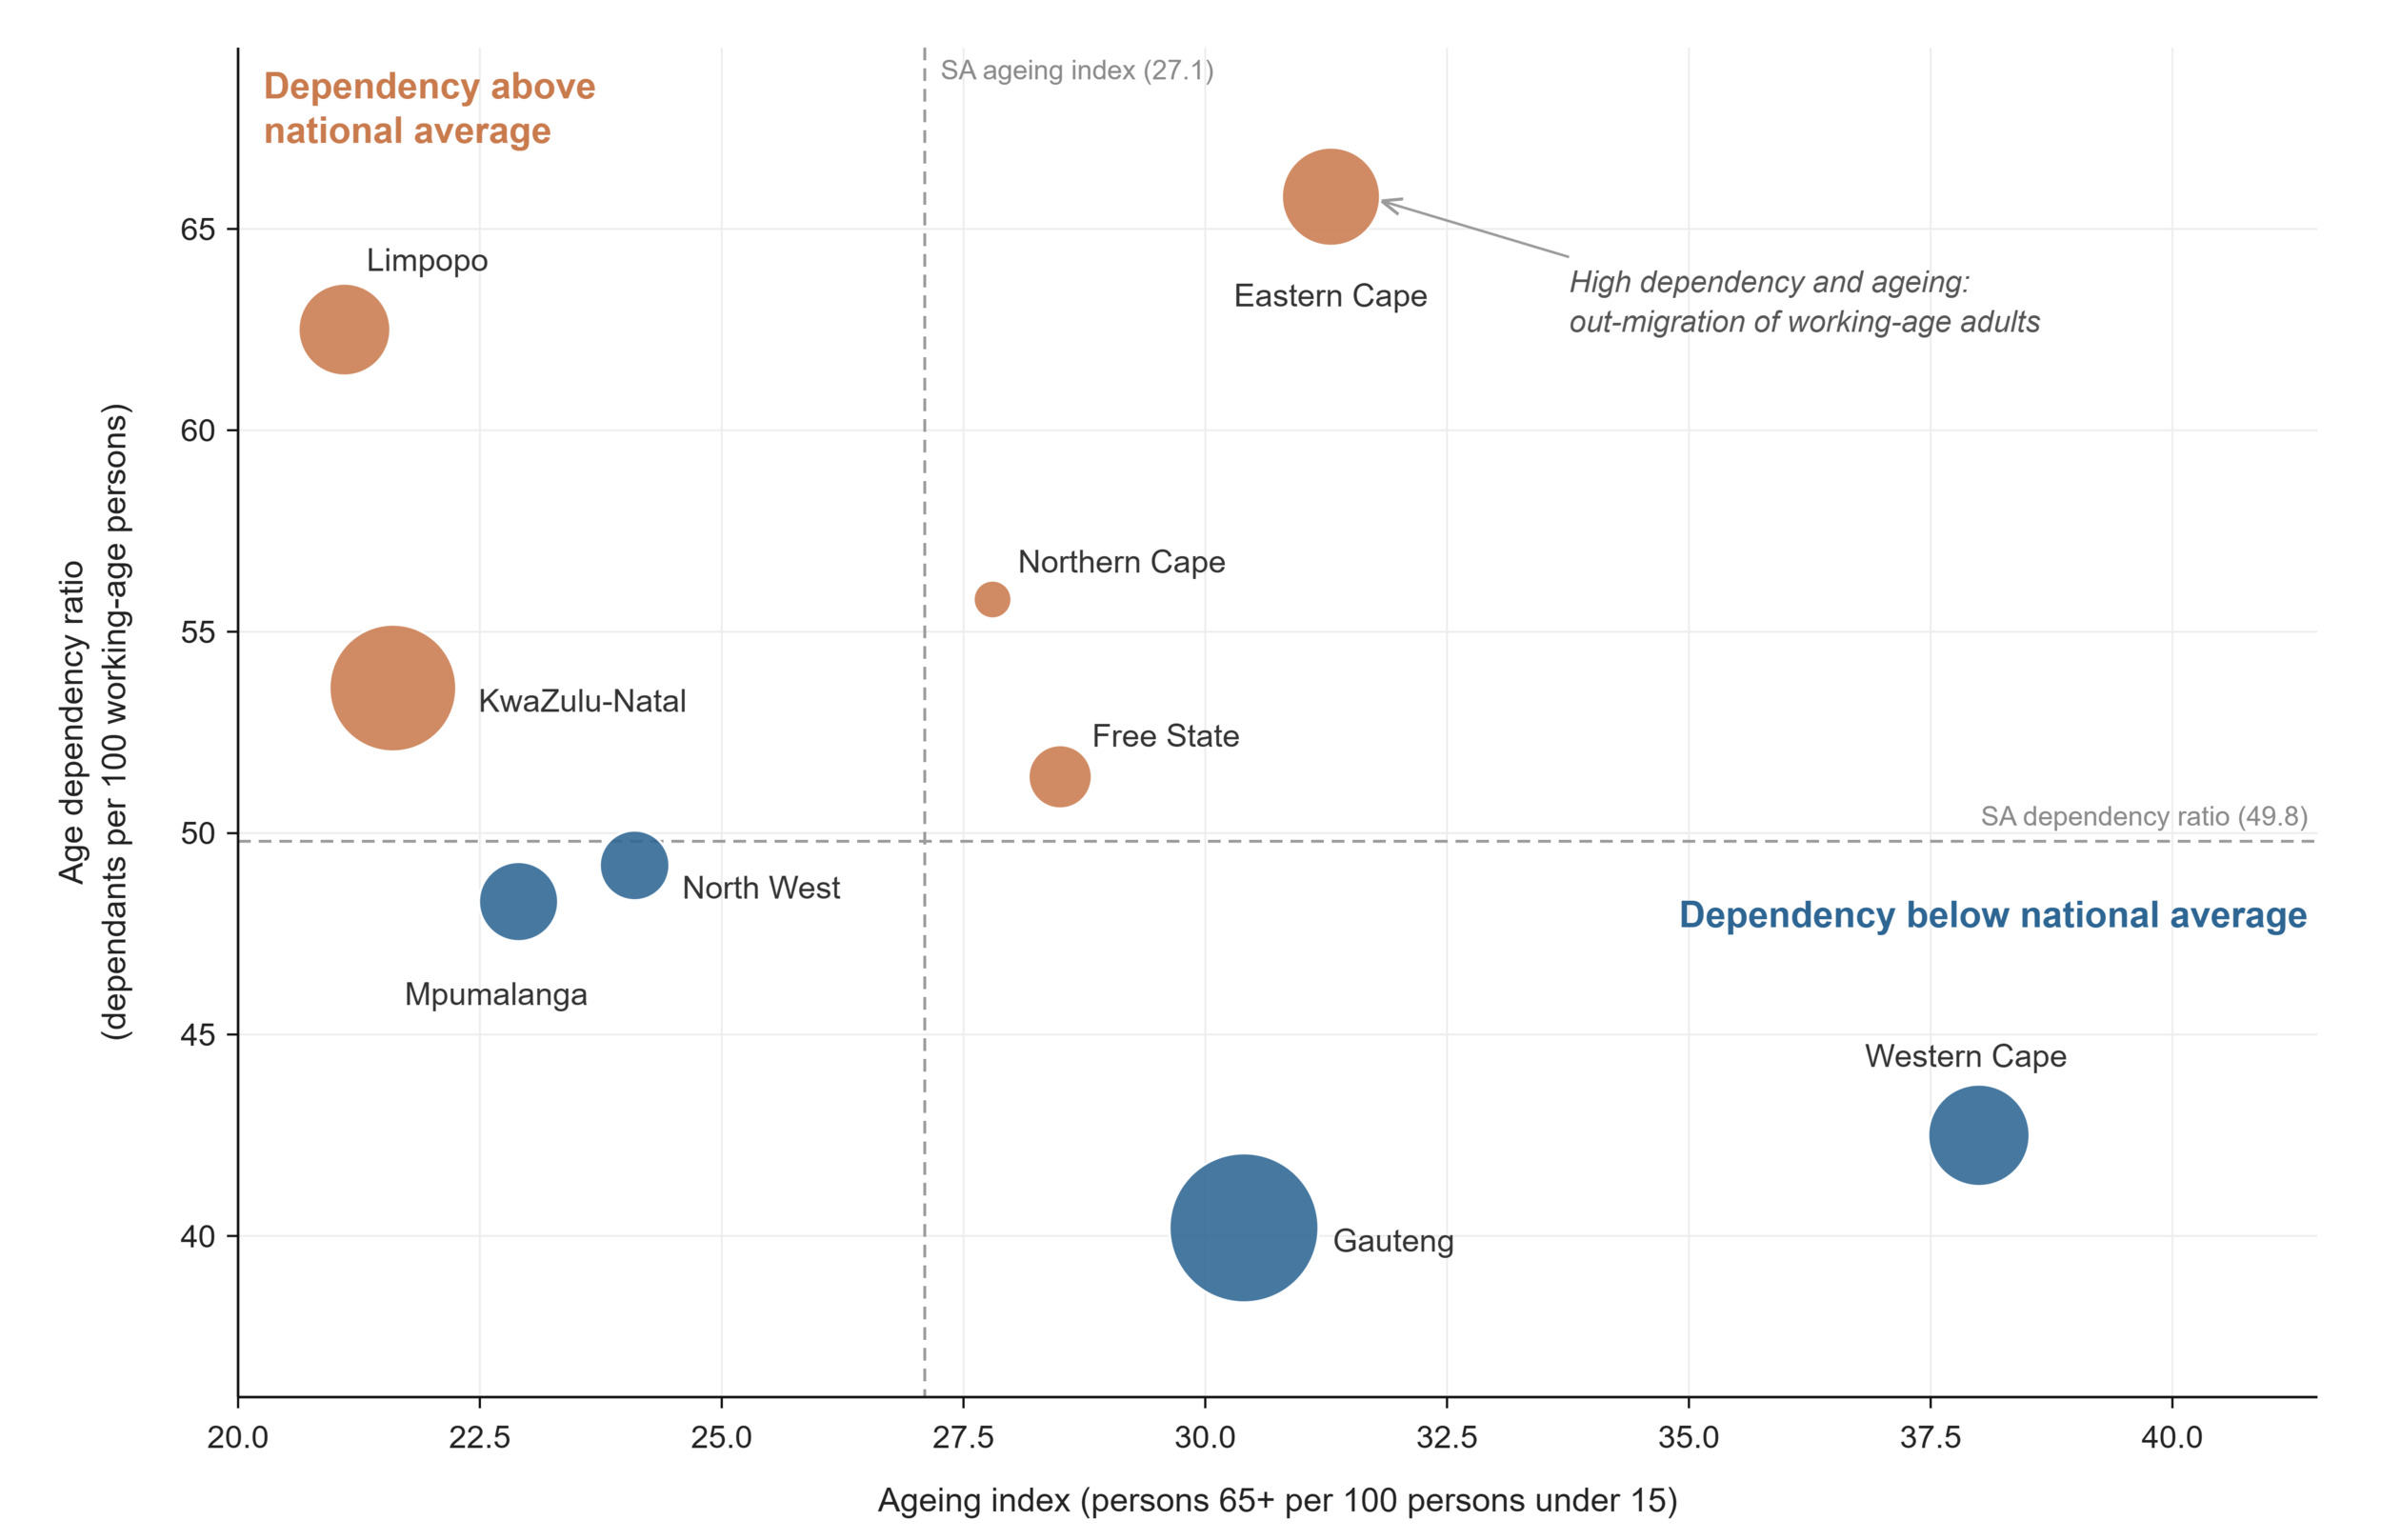
Figure 2.Provincial demographic profiles: ageing index versus age dependency ratio, 2025
For health service planning, the most consequential demographic figure is the public-sector-dependent population: an estimated 54.1 million people, 85.8% of the national total, rely on public health services, ranging from roughly three-quarters of the population in the Western Cape (74.3%), to more than nine in ten in Limpopo (91.8%), North West (91.1%), and KwaZulu-Natal (90.5%).7,13 Provinces with the heaviest dependency burdens are thus also those where the public sector carries the largest share of the population, compounding the equity challenge that later sections on personnel and financing will quantify.7,13
The population denominators underpinning every rate in this paper differ by source, therefore a caution applies to this entire paper, for documented methodological reasons. The sources of this divergence, and the denominator conventions applied throughout this paper, are described in the Method section.
Learning signals: demographic indicators
What does the data reveal? South Africa's provinces are on divergent demographic paths, shaped by internal labour migration. Metropolitan provinces are ageing with low dependency ratios, labour-sending provinces remain young with high dependency, and the EC carries both burdens at once, with the country's second highest ageing index alongside its highest dependency ratio. These trajectories imply different service demands: growing chronic and geriatric care needs in GP and WC, sustained maternal and child health demand in LP and KZ, and both simultaneously in EC. Population growth in receiving provinces also compounds pressure on facilities faster than national averages suggest.
Is the system responding? Demography is one domain where the first two arcs of the learning cycle demonstrably function: the mid-year population estimates are produced annually, feed directly into coverage denominators configured in webDHIS, and inform the health component of the provincial equitable share formula through which resources are allocated.7 What is less evident, is whether service planning is adjusting to the direction of demographic change rather than its current level, for example, whether provinces with rapidly rising ageing indices are re-orienting primary care toward chronic disease and long-term care ahead of demand, and whether facility planning in GP anticipates continued in-migration.
What prevents learning? The central issue is denominator inconsistency, which is documented, but consequential. Stats SA is transparent about why its two-population series differ: the GHS remains benchmarked to the 2017 series while the mid-year estimates are updated annually, with rebasing limited to roughly five-year intervals to preserve statistical stability. That transparency is itself a mark of a maturing statistical system. The learning risk sits downstream with users: survey-based rates and routine DHIS rates in this SAHR divide by denominators from different series, so small differences between them may be artefacts of benchmarking rather than real signals, and there is little evidence that this caveat travels with the indicators into district-level planning. Two further gaps compound the problem. The transition to the 2025 series, incorporating Census 2022, will introduce a break in every weighted time series that must be actively managed if trend-based learning is not to be disrupted. And internal migration, the force reshaping provincial demography, enters the projections as a model assumption rather than a measured flow, leaving the system to plan around its most dynamic variable with its weakest data. Fertility estimates show a parallel source divergence: national series place the total fertility rate above replacement (2.21–2.23), while the GBD places it below (1.9), a gap with materially different implications for long-term planning. |
Table 1.Demographic indicators
| Indicator |
Period |
SA |
EC |
FS |
GP |
KZ |
LP |
MP |
NC |
NW |
WC |
Ageing index
both sexes mid-yeara |
2025 |
27.1 |
31.3 |
28.5 |
30.4 |
21.6 |
21.1 |
22.9 |
27.8 |
24.1 |
38 |
Age dependency ratio
both sexes mid-yeara |
2025 |
49.8 |
65.8 |
51.4 |
40.2 |
53.6 |
62.5 |
48.3 |
55.8 |
49.2 |
42.5 |
Annual population growth rate
both sexes mid-yeara |
2025 |
1.2 |
|
|
|
|
|
|
|
|
|
Crude death rate (deaths per 1 000 population)
both sexes mid-yeara |
2025 |
8.8 |
|
|
|
|
|
|
|
|
|
Live birth occurrences registered
vital registration totalb |
2024 |
863 858 |
93 308 |
40 648 |
207 120 |
183 377 |
105 384 |
69 613 |
22 943 |
51 910 |
89 543 |
Live birth occurrences registered
vital registration 15-19 yearsb |
2024 |
120 785 |
|
|
|
|
|
|
|
|
|
Population
both sexes mid-yeara |
2025 |
63 100 945 |
7 090 788 |
3 039 834 |
16 104 933 |
12 232 247 |
6 366 192 |
5 076 133 |
1 379 183 |
4 183 947 |
7 627 688 |
| female mid-yeara |
32 228 839 |
|
|
|
|
|
|
|
|
|
| male mid-yeara |
30 872 106 |
|
|
|
|
|
|
|
|
|
| both sexes GHSc |
64 071 685 |
6 530 280 |
3 079 142 |
17 401 837 |
12 231 106 |
6 362 977 |
5 099 127 |
1 335 200 |
4 386 467 |
7 645 549 |
| both sexes GBDd |
60 500 000 |
|
|
|
|
|
|
|
|
|
Population % by province
both sexes mid-yeara |
2025 |
100 |
11.2 |
4.8 |
25.5 |
19.4 |
10.1 |
8.0 |
2.2 |
6.6 |
12.1 |
Population density
mid-yeara |
2025 |
51.7 |
42.0 |
23.4 |
886.0 |
129.6 |
50.6 |
66.4 |
3.7 |
39.9 |
58.8 |
Public sector dependent (uninsured) population
both sexes all ages GHSc |
2025 |
54 111 164 |
5 883 413 |
2 715 084 |
13 554 517 |
11 071 228 |
5 842 515 |
4 455 975 |
1 112 249 |
3 812 167 |
5 664 015 |
Total fertility rate
female GBDd |
2023 |
1.9 |
|
|
|
|
|
|
|
|
|
| female THEMBISAe |
2025 |
2.2 |
|
|
|
|
|
|
|
|
|
| female mid-yeara |
2.2 |
|
|
|
|
|
|
|
|
|
REFERENCE NOTES
a Stats SA MYE 2025
b Stats SA Recorded Live Births 2024
c Stats SA GHS 2025
d GBD 2023
e THEMBISA 5.0
DEFINITIONS
Age dependency ratio [Number] — The ratio of the combined child population (0-14 years) and the aged population (65 years and over) - persons in the dependent ages - to every 100 people of the intermediate age population (15-65 years) - economically active ages.
Ageing index [Number] — Ratio of the number of people 65+ to the number under 15 years. i.e., a value of 16 means there are 16 people aged 65 and over for every 100 under 15 years of age. Calculated as ([65+/0-14]*100).
Annual population growth rate [Percentage] — The rate at which the population is increasing or decreasing in a given year, expressed as a percentage of the base population size. It takes into consideration all the components of population growth, namely births, deaths and migration.
Crude death rate (deaths per 1 000 population) [per 1 000 population] — Number of deaths in a year per 1 000 population.
Live birth occurrences registered [Number] — The number of live birth occurrences registered.
Population [Number] — Total number of people. Projected population figures are based on various projection models. GHS: population figures are based on mid-year population estimates produced for 2025 using the 2017 series mid-year population estimates.
Population % by province [Percentage] — Proportion of South African population in each province (calculated from population per province and population for whole of South Africa).
Population % composition [Percentage] — Percentage of the population by various categories - e.g., Percentage of South African population under age of 15 years. Percentage of South African population over age of 60 years. Percentage of South African population female.
Population density [people per km2] — The number of people per square kilometre.
Public sector dependent (uninsured) population [Number] — This is an adjustment of the total population to the number assumed to be dependent on services in the public health sector based on medical scheme (health insurance) coverage. It is calculated by subtracting the number of people with medical scheme cover (determined from medical scheme membership reports, or surveys indicating percentage of population on medical schemes) from the total population.
Total fertility rate [Number] — The average number of children that a woman gives birth to in her lifetime, assuming that the prevailing rates remain unchanged. Estimates are reported from more than one series: the Thembisa model and the Stats SA mid-year population estimates use different fertility assumptions and are not interchangeable, so each row is labelled by source.
Socio-economic and environmental risk
Health outcomes are produced as much outside the health system as within it. The socio-economic and environmental conditions in which South Africans live, their access to water, sanitation, energy and education, the air they breathe, and their prospects of employment, set the baseline against which every health service indicator in this paper must be read. South Africa’s Human Development Index stood at 0.741 in 2024, ranking the country 106th globally,6 a summary figure that conceals the profound internal variation that the indicators below reveal (Table 2).
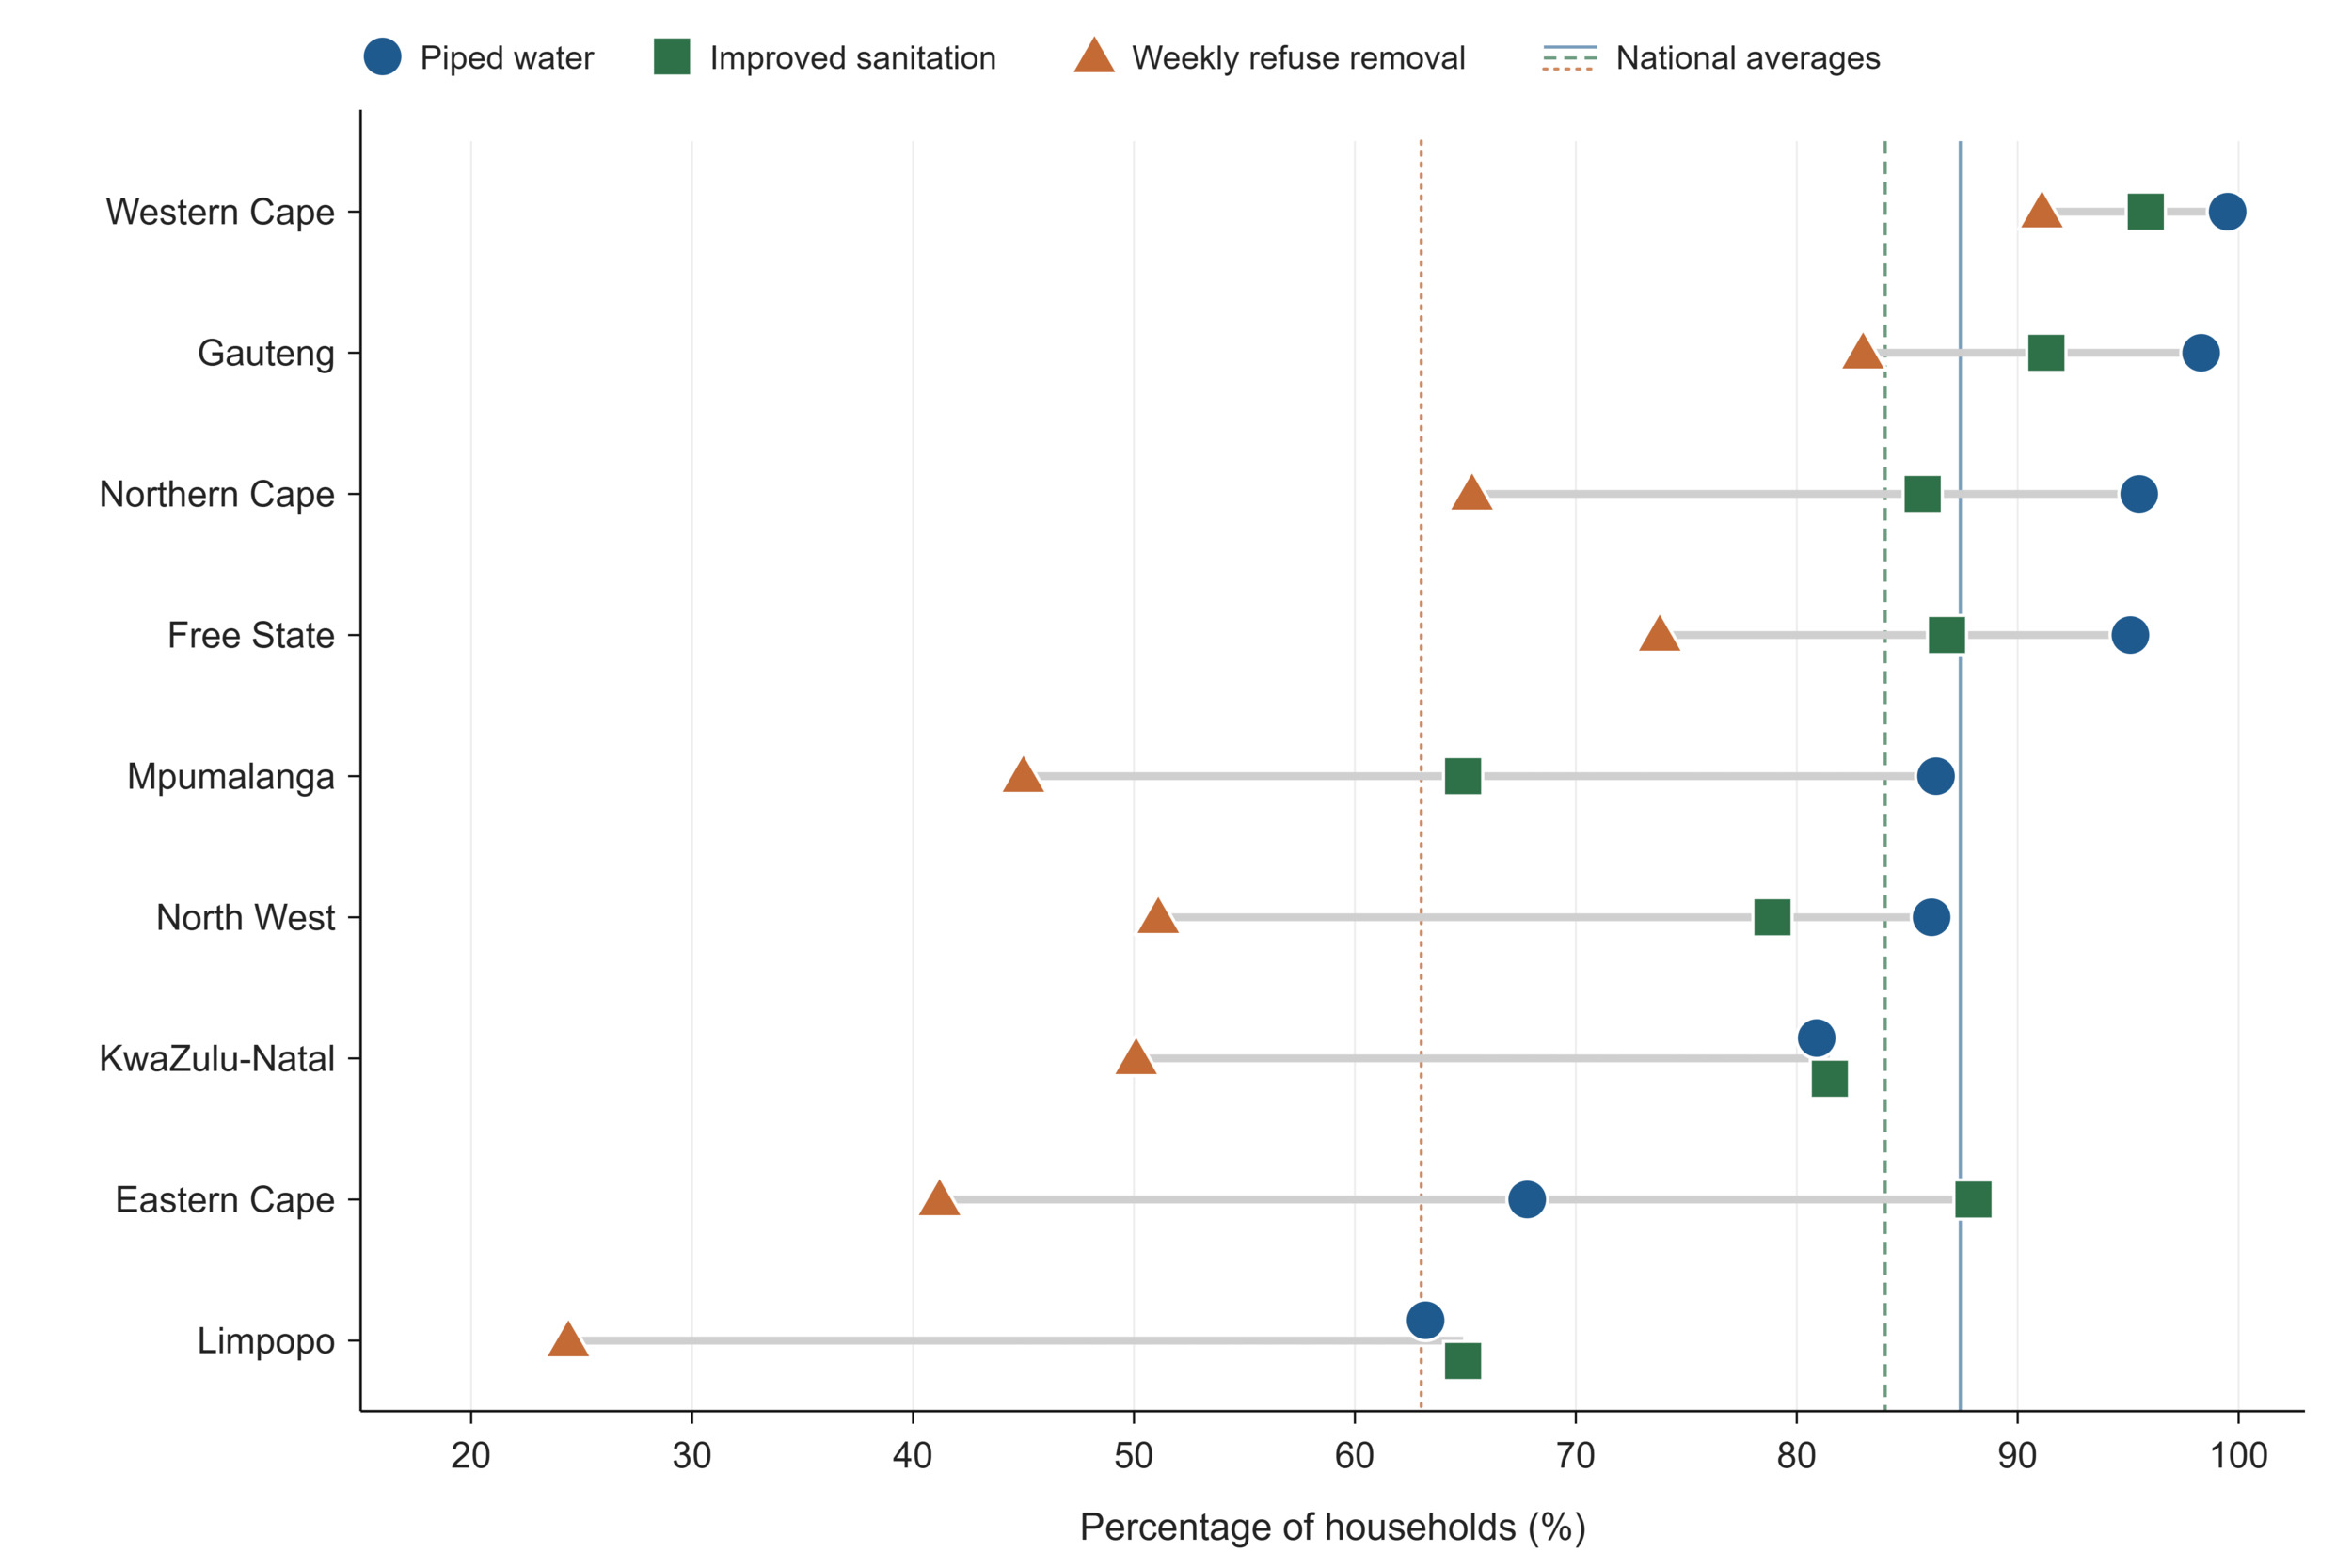
The national picture on basic services shows steady but incomplete coverage: 87.4% of households have access to piped water, 84.0% to improved sanitation, and 62.9% receive weekly refuse removal.8 The provincial spread beneath these averages, however, is among the widest of any domain in this paper (Figure 3). Access to piped water ranges from 99.5% in the Western Cape and 98.3% in Gauteng down to 63.2% in Limpopo and 67.7% in the Eastern Cape, a gap of more than 30 percentage points between the best- and worst-served provinces. The pattern repeats for sanitation, where Limpopo and Mpumalanga (both 64.8%) trail the Western Cape (95.9%) by over 30 points, and is most extreme for refuse removal, where coverage in Limpopo (24.3%) is barely a quarter of that in the Western Cape (91.1%). Where municipal refuse services are absent, households manage waste themselves: just over half of South African households (51.1%) burn some or all of their solid waste, rising to 73.6% in the Northern Cape and 71.2% in North West, a practice with direct implications for respiratory health and local air quality.14
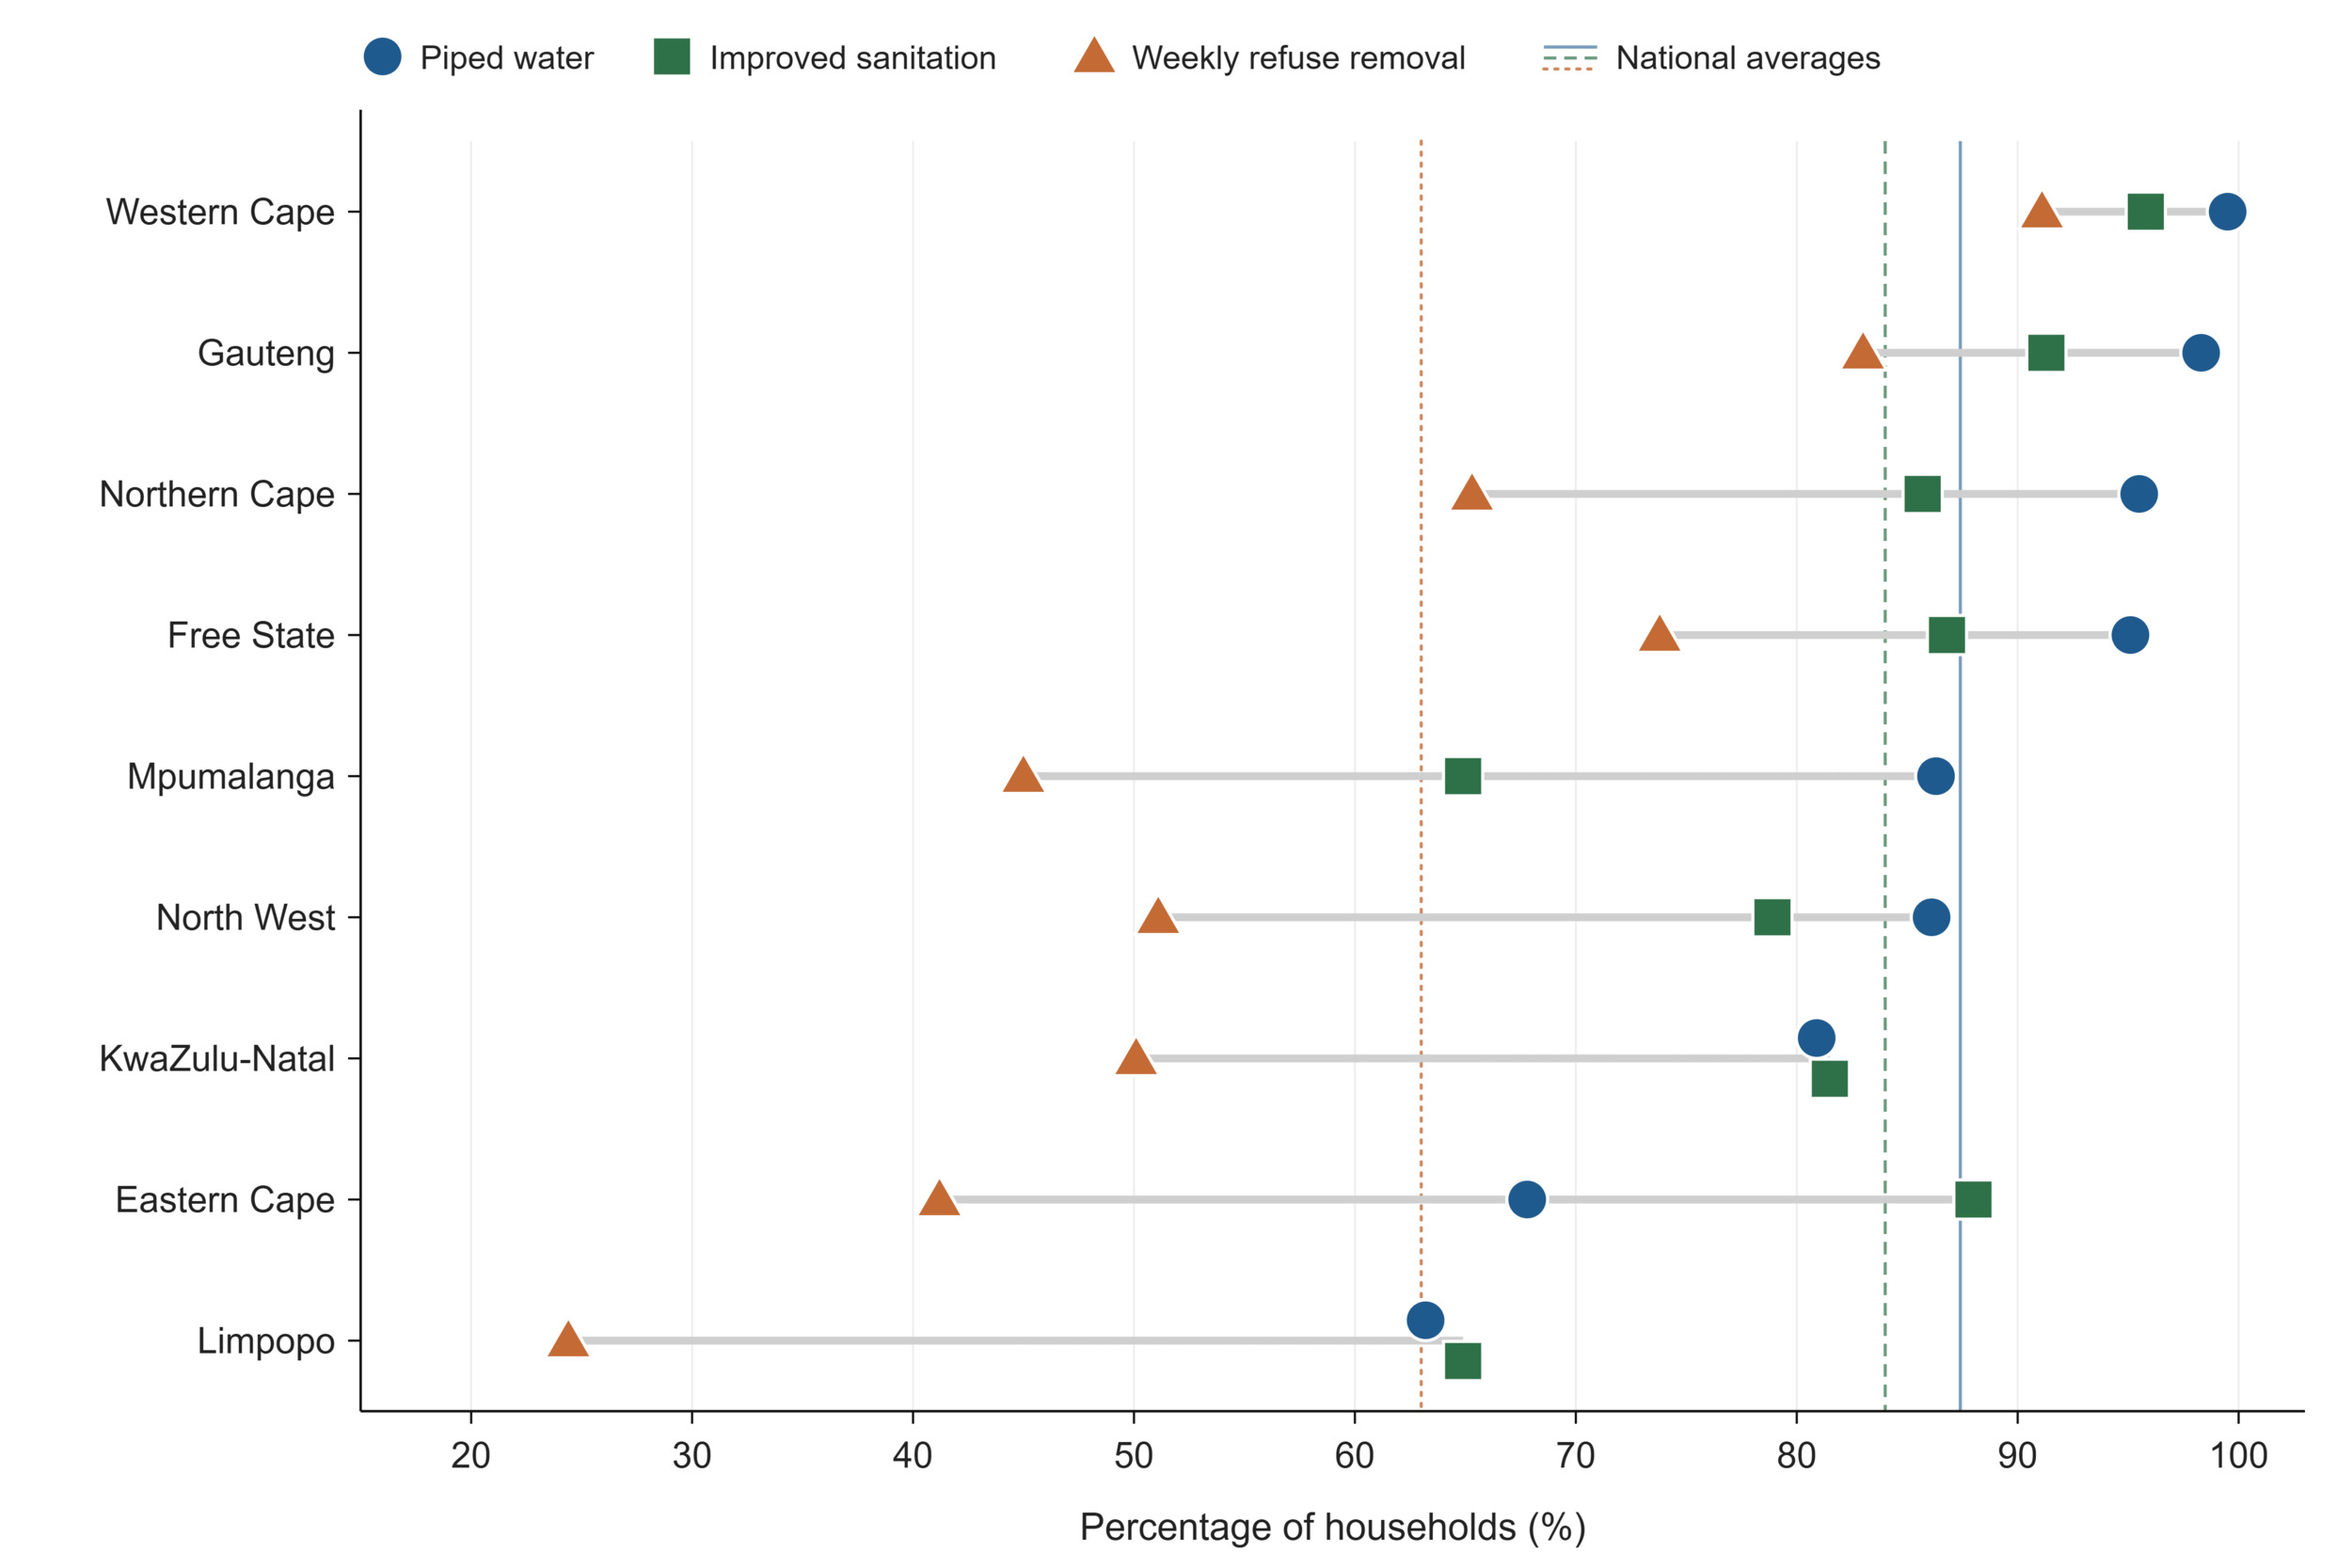
Figure 3.Household access to basic services by province, 2025
Notably, these service deficits do not track a single axis of deprivation. Limpopo records the highest proportion of formal dwellings in the country (96.8%), a pattern that reflects largely rural, low-density settlement in the former homeland areas, where households occupy self-built formal structures on traditional-authority land rather than the backyard rooms and informal settlements that account for much of the housing stock in the metropolitan provinces.8 while simultaneously recording the lowest access to piped water and refuse removal, meaning formality of housing without the services that make housing healthy. Conversely, the most urbanised provinces carry a different risk profile: informal dwellings are most prevalent in North West (19.2%), Gauteng (18.9%), and the Western Cape (17.6%), indicating persistent pressure on urban housing provision and informal settlement upgrading.8 Environmental exposure follows the same split. Annual mean PM2.5 concentrations are highest in Gauteng at 45.7 µg/m3, roughly nine times the WHO guideline value of 5 µg/m3, and in the North West (30.4 µg/m3), while the Western Cape (3.4 µg/m3) is the only province within the guideline.15,16 In effect, the data describes two distinct deprivation profiles: a rural profile of absent basic services concentrated in Limpopo and the Eastern Cape, and an urban profile of informality and air pollution concentrated in Gauteng and other metropolitan provinces. Each demands a different intersectoral response.
Educational and economic indicators reinforce the same geography. The percentage of adults aged 20 and older with no schooling is highest in Mpumalanga (5.1%) and Limpopo (5.0%) and lowest in the Western Cape (0.8%) and Gauteng (1.0%).8 Official unemployment stood at 31.4% nationally in the fourth quarter of 2025, ranging from 18.1% in the Western Cape to 42.5% in the Eastern Cape.17 Female-headed households, a group consistently associated with heightened economic vulnerability, constitute 42.6% of households nationally, but 48.4% in KwaZulu-Natal and 48.1% in the Eastern Cape, and are markedly more common in rural (47.6%) than urban (40.4%) areas. Nearly one in five households nationally reports experiencing air pollution problems (18.8%), and one in six water pollution problems (16.9%) in their living environment.8
Disability remains an under-measured determinant of both need and access. The GHS estimates that 5.2% of persons aged five years and older live with a disability,8 yet disability status is not captured in routine DHIS reporting, so none of the service indicators in this paper can be disaggregated by disability. For a population group with systematically higher health needs and well-documented access barriers, this is an equity-relevant blind spot in its own right.
Learning signals: socio-economic and environmental indicators
What does the data reveal? Provincial variation in the social determinants of health is wider than in most health service indicators, and it follows two distinct profiles: rural service deprivation (water, sanitation, refuse removal, education) concentrated in LP and EC, and urban environmental risk (informal housing, air pollution) concentrated in GP and other metropolitan provinces. The LP paradox, the country's highest formal-housing rate alongside its lowest water and refuse coverage, is a caution against reading any single indicator as a proxy for deprivation.
Is the system responding? The determinants in this domain lie largely outside the health sector's direct control, which makes them the sharpest test of whether South Africa can learn across sectors rather than merely within them. The sources reviewed did not identify routine mechanisms through which district health planning systematically integrates GHS data to anticipate demand or target prevention. Similarly, evidence of routine linkage between environmental health information and the DHIS was not identified. An LHS would treat this data as an early-warning layer for the health sector, not as background context.
What prevents learning? In terms of disaggregation, several key indicators, including the Human Development Index and household-reported pollution problems, are available only nationally, and none of the indicators in this domain is routinely available below provincial level, even though deprivation is known to vary sharply between districts. When it comes to environmental monitoring coverage, provincial PM2.5 estimates depend substantially on satellite-derived data because South Africa’s ground-based air-quality monitoring system has important continuity and completeness gaps. Monitoring stations are frequently offline, and power interruptions and equipment faults have contributed to incomplete datasets. Satellite-derived estimates therefore provide an important complementary source of spatial exposure information.18 |
Table 2.Socio-economic and environmental indicators
| Indicator |
Period |
SA |
EC |
FS |
GP |
KZ |
LP |
MP |
NC |
NW |
WC |
Air pollution level in cities (particulate matter [PM])
AQLI PM2.5a |
2023 |
22.3 |
8.2 |
22.1 |
45.7 |
15.7 |
15.6 |
22.8 |
30.4 |
10.2 |
3.4 |
Percentage distribution of households who experience specific kinds of environmental problems
GHS Water pollutionb |
2025 |
16.9 |
22 |
|
|
|
|
|
|
|
|
| GHS Air pollutionb |
18.8 |
22 |
|
|
|
|
|
|
|
|
Human development index (high value = best)
both sexes all ages UNDPc |
2024 |
0.7 |
|
|
|
|
|
|
|
|
|
Human development index rank (1= best)
both sexes all ages UNDPc |
2024 |
106 |
|
|
|
|
|
|
|
|
|
Education level: percentage of population with no schooling
both sexes 20+ years GHSb |
2025 |
2.6 |
3.2 |
2.4 |
1 |
3.4 |
5 |
5.1 |
4.1 |
4.3 |
0.8 |
| Percentage of female headed households GHSb |
2025 |
42.6 |
48.1 |
44 |
36.2 |
48.4 |
47.1 |
43.6 |
47.3 |
40.6 |
42 |
| female GHS ruralb |
47.6 |
|
|
|
|
|
|
|
|
|
| female GHS urbanb |
40.4 |
|
|
|
|
|
|
|
|
|
Percentage of households by type of housing
both sexes GHS formalb |
2025 |
84.2 |
78.3 |
84.4 |
80.5 |
86.5 |
96.8 |
91 |
86.5 |
80.7 |
81.8 |
| both sexes GHS informalb |
|
12.1 |
5.3 |
14.4 |
18.9 |
4.8 |
2.6 |
5 |
13.2 |
19.2 |
17.6 |
| both sexes GHS otherb |
|
0.3 |
0.2 |
0 |
0.6 |
0 |
0.1 |
0.1 |
0 |
0 |
0.4 |
| both sexes GHS traditionalb |
|
3.4 |
16.2 |
1.2 |
0.1 |
8.7 |
0.5 |
3.9 |
0.3 |
0.1 |
0.1 |
Percentage of households using electricity for cooking
both sexes GHSb |
2025 |
75.5 |
77.3 |
82.4 |
75.7 |
81 |
57.2 |
71.8 |
77.1 |
81.6 |
74.9 |
Percentage of households with access to improved sanitation
both sexes GHS formalb |
2025 |
84 |
88 |
86.8 |
91.3 |
81.5 |
64.8 |
64.8 |
85.7 |
78.8 |
95.9 |
Percentage of households with access to piped water
both sexes GHSb |
2025 |
87.4 |
67.7 |
95.1 |
98.3 |
81.2 |
63.2 |
86.3 |
95.5 |
86.1 |
99.5 |
Percentage of households with no toilet / bucket toilet
both sexes GHS formalb |
2025 |
0.8 |
2.4 |
0.3 |
0.1 |
1 |
0.9 |
1.3 |
2.5 |
0.9 |
0.3 |
Percentage of households with refuse removal
both sexes GHS removed at least once per weekb |
2025 |
62.9 |
41.2 |
73.7 |
83.1 |
50.2 |
24.3 |
45 |
65.3 |
51.1 |
91.1 |
Percentage of households with telephone (telephone in dwelling or cell phone)
both sexes GHS only cellb |
2025 |
93.8 |
92 |
91.9 |
93.5 |
95.5 |
95.6 |
95.2 |
89.5 |
93.7 |
92.9 |
Percentage distribution of households that burn some or all of their solid waste
both sexes GHS weekly/bi-weeklyb |
2025 |
51.1 |
61.1 |
65.9 |
37.4 |
59.9 |
41.9 |
59.6 |
73.6 |
71.2 |
48.4 |
Unemployment rate (official definition)
both sexes 15-64 years LFSd |
2025 Q4 |
31.4 |
42.5 |
37.2 |
33 |
32.3 |
28.2 |
34 |
27.1 |
35.1 |
18.1 |
| male 15-64 years LFSd |
34.6 |
|
|
|
|
|
|
|
|
|
| female 15-64 years LFSd |
28.8 |
|
|
|
|
|
|
|
|
|
REFERENCE NOTES
a AQLI 2025
b Stats SA GHS 2025
c HDR 2025
d Labour Force Survey Q4 2025
DEFINITIONS
Air pollution level in cities (particulate matter [PM]) [ug/m3] — Annual mean concentration of particulate matter of less than 2.5 microns of diameter (PM2.5) [ug/m3] (or of less than 10 microns [PM10] if PM2.5 is not available) in cities.
Education level: percentage of population with no schooling [Percentage] — Percentage of people in a given age group who have received a particular level of education. Data are presented for the percentage of the population aged 20 years and above with no schooling.
Human development index (high value = best) [Number] — The HDI is a summary measure of human development. It measures the average achievements in a country in three basic dimensions of human development: * A long and healthy life, as measured by life expectancy at birth * Knowledge, as measured by the adult literacy rate (with two-thirds weight) and the combined primary, secondary and tertiary gross enrolment ratio (with one-third weight) * A decent standard of living, as measured by GDP per capita (PPP US$). Caution: Calculation of HDI is an evolving methodology, and comparisons should not be made between years (when methods might have varied) but can be made between countries, as issued by the same source. A high value for the HDI represents better human development.
Human development index rank (1= best) [Number] — Rank from 1 to end given to each country according to value of HDI. Value of 1 represents the best (highest) human development index.
Percentage distribution of households that burn some or all of their solid waste [Percentage] — Percentage distribution of households that burn some or all of their solid waste.
Percentage distribution of households who experience specific kinds of environmental problems — The percentage of households that report experiencing each specified environmental problem in the area where they live. The environmental problems assessed by the Statistics South Africa General Household Survey include: littering, irregular or no waste removal, outdoor or indoor air pollution, water pollution, land degradation or over-utilisation of natural resource, excessive noise or noise pollution. Households may report more than one environmental problem, so the percentages across categories should not be expected to total 100%. The indicator reflects households’ reported experiences or perceptions rather than objectively measured environmental conditions.
Percentage of female headed households [Percentage] — Percentage of female headed households.
Percentage of households by type of housing [Percentage] — Percentage of households that are categorised as formal, informal, traditional or other.
Percentage of households using electricity for cooking [Percentage] — Percentage of households using electricity as their main energy source for cooking.
Percentage of households with access to improved sanitation [Percentage] — Percentage of households using improved sanitation facilities (including flush to piped sewer system, flush to septic tank, flush/pour flush to pit, flush/pour flush to elsewhere).
Percentage of households with access to piped water [Percentage] — Includes households with piped water in dwelling, piped water inside yard or piped water on a community stand (< 200m away or further).
Percentage of households with no toilet / bucket toilet [Percentage] — Percentage of households that have no toilet, or were using a bucket toilet.
Percentage of households with refuse removal [Percentage] — Percentage of households that have refuse removal by the local authority at least once a week.
Percentage of households with telephone (telephone in dwelling or cell phone) [Percentage] — Percentage of households with a telephone in the dwelling or a cellular telephone.
Unemployment rate (official definition) [Percentage] — The official definition of the unemployed is that they are those people within the economically active population (aged 15-65) who (a) did not have a job or business during the 7 days prior to the interview, (b) want to work and are available to work within two weeks of the interview, and (c) have taken active steps to look for work or to start some form of self-employment in the 4 weeks prior to the interview. Note that the census produces lower estimates of labour force participation because there are less prompts to identify employed people, and the Labour Force Survey provides the official labour market statistics.
Health status indicators
Communicable diseases
Communicable disease surveillance in South Africa relies on an integrated national surveillance architecture that combines routine case notification, laboratory-based surveillance, sentinel surveillance and event-based surveillance to detect, monitor, and respond to public health threats. These surveillance platforms are delivered through a network of institutions. Routine notification of notifiable medical conditions is enabled through the National Notifiable Medical Conditions Surveillance System (NMCSS), while laboratory and specialised surveillance are supported by the National Health Laboratory Service (NHLS) and the National Institute for Communicable Diseases (NICD) through a range of national reference laboratories and surveillance programmes. Together, these complementary surveillance systems provide the evidence base for monitoring communicable disease trends, detecting outbreaks, characterising pathogens and antimicrobial resistance, and informing public health action. By linking surveillance data to outbreak response, immunisation programmes, treatment guidelines and public health policy, they form a critical component of South Africa’s LHS.19–21
This section (Table 3) synthesises findings from these surveillance systems to review major communicable disease trends during 2024–2026, excluding HIV and tuberculosis, which are discussed separately in this paper. The period was characterised by several important surveillance signals, including the resurgence of vaccine-preventable diseases, evolving antimicrobial resistance, changing malaria transmission patterns, and operational challenges arising from the June 2024 cyberattack on the NHLS, which disrupted laboratory information systems that underpin several national surveillance platforms. Because surveillance findings are event-based, this section departs from the provincial indicator-table structure used elsewhere in the paper: trends are presented nationally, with provincial detail where the surveillance platforms provide it.19
Vaccine-preventable and epidemic-prone diseases
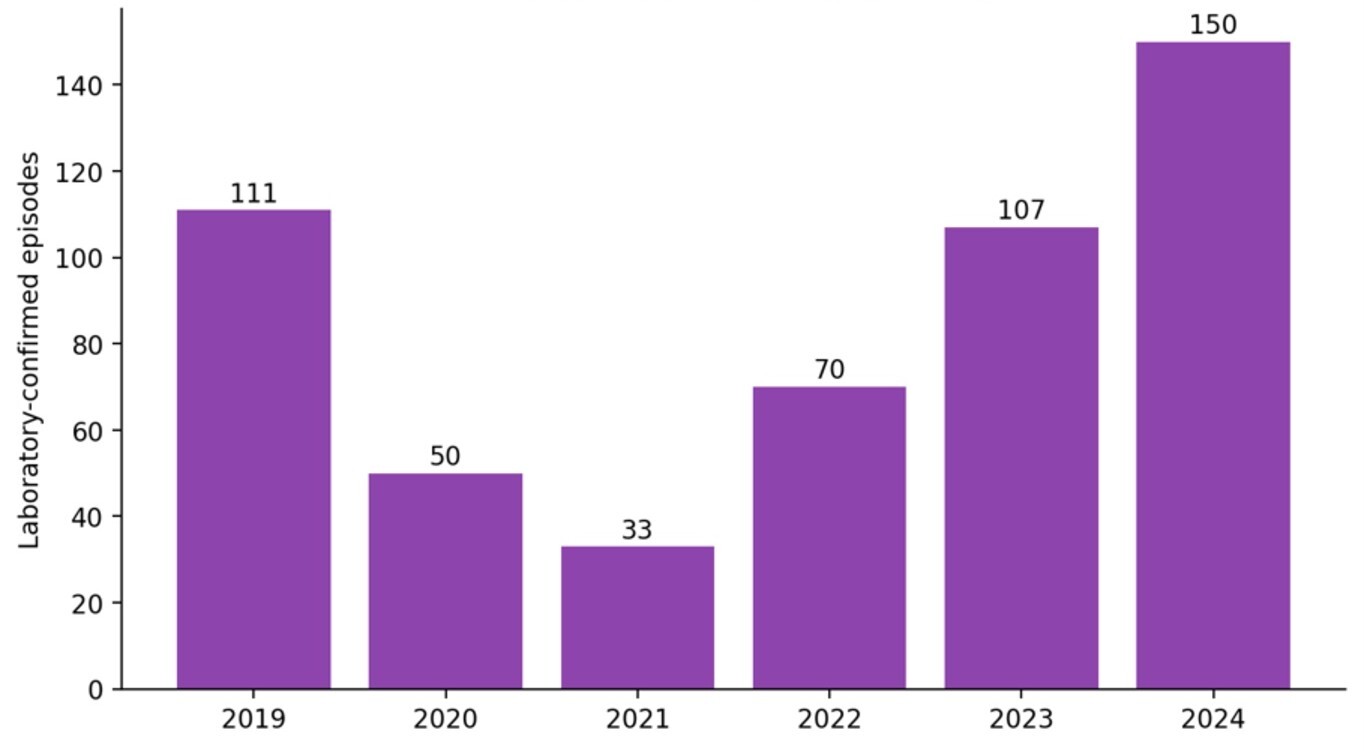
Laboratory surveillance indicates that invasive meningococcal disease (IMD) has increased substantially since the marked decline observed during the COVID-19 pandemic. GERMS-SA recorded a peak incidence of 1.4 episodes per 100 000 population in 2006, followed by a sustained decline to a historic low of 0.05 per 100 000 in 2021, before increasing to 0.12 per 100 000 in 2022, 0.18 per 100 000 in 2023 and 0.24 per 100 000 in 2024. The number of laboratory-confirmed episodes increased from 33 in 2021 to 70 in 2022, 107 in 2023, and 150 in 2024 (Figure 4). These findings indicate a sustained resurgence of IMD following the pandemic-related decline.22
Serogroup B has been the predominant cause of disease since 2016, replacing the previously dominant serogroup W.23 Infants continue to experience the highest incidence, reaching 2.4 episodes per 100 000 population in 2024, while the Western Cape recorded the highest provincial incidence at 0.81 per 100 000.22 Despite its relatively low incidence, IMD remains a severe disease, with a case-fatality ratio historically estimated at approximately 17%, and approximately one in five survivors experiencing long-term sequelae.23
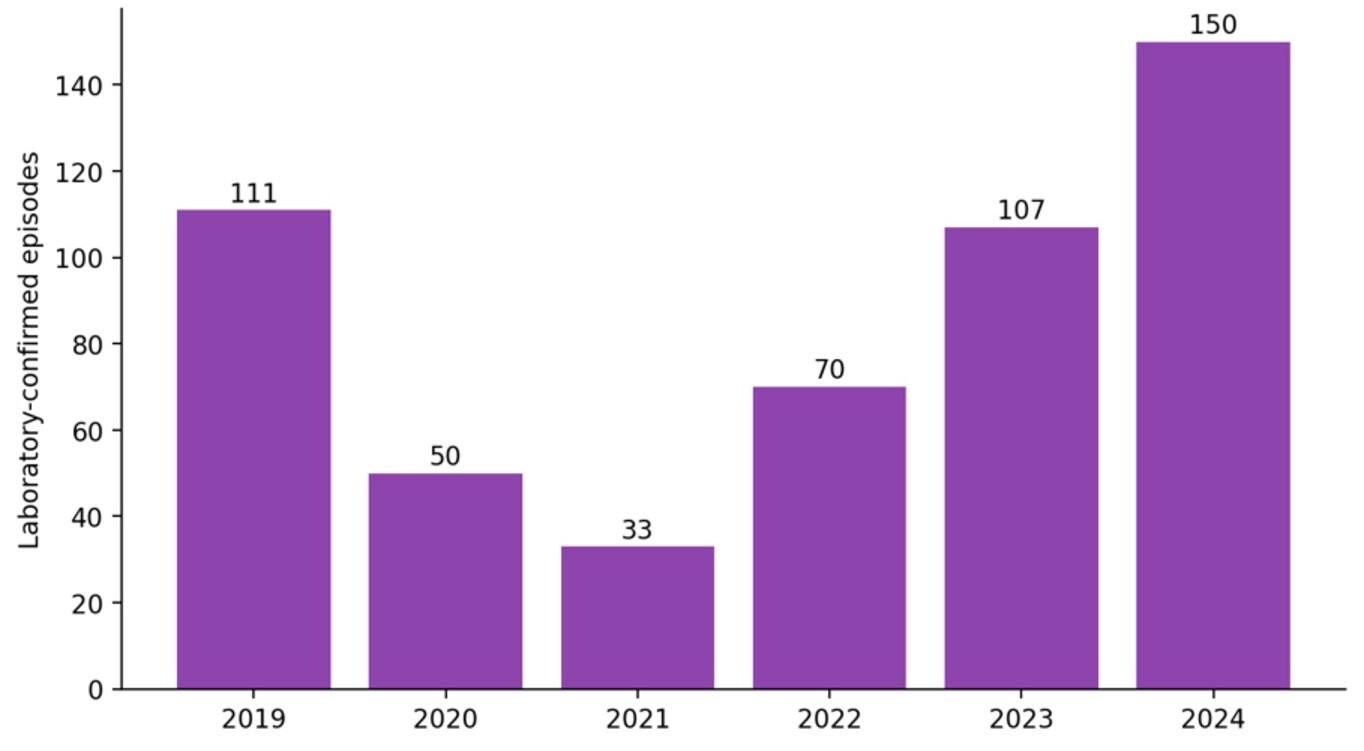
Figure 4.Laboratory-confirmed invasive meningococcal disease episodes, South Africa, 2019–2024
Source: National Institute for Communicable Diseases, 2025.23
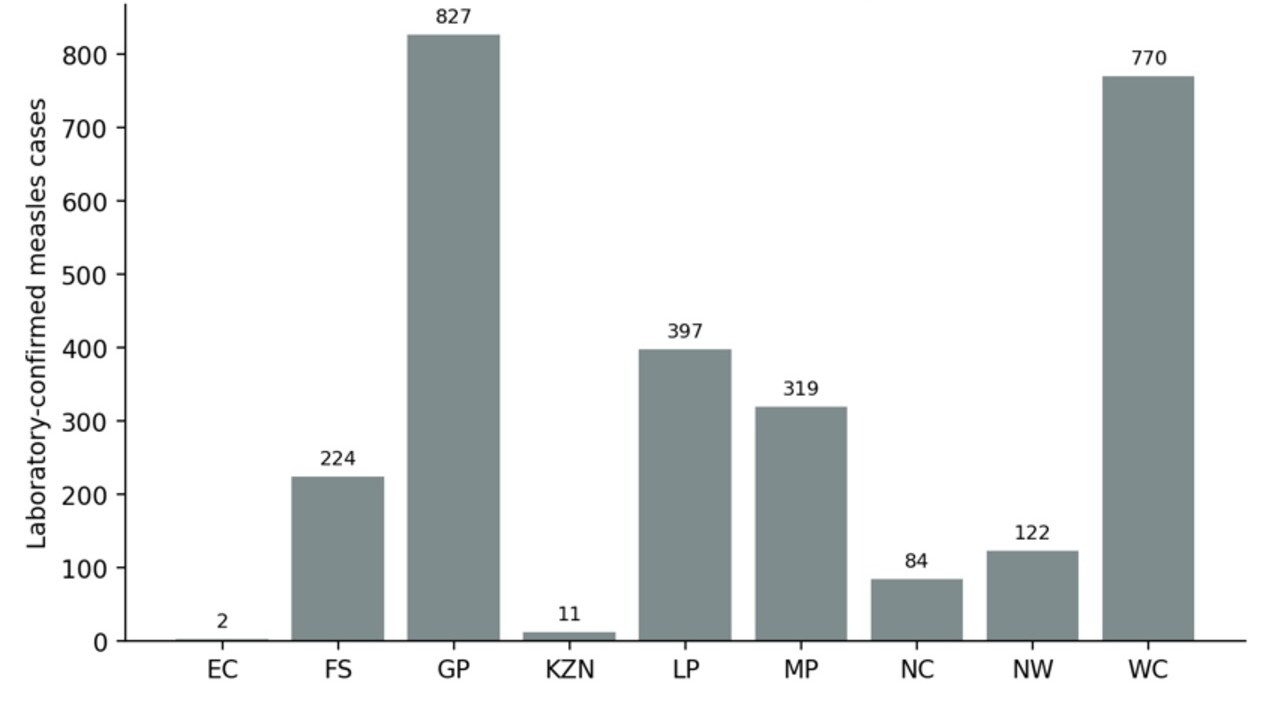
South Africa experienced a large measles outbreak during 2025, with 2 756 laboratory-confirmed cases reported nationally by the end of the year. Gauteng (827 cases; 30%) and the Western Cape (770; 28%) accounted for almost three-fifths of all confirmed cases, with transmission in Gauteng concentrated mainly in the City of Johannesburg and the City of Tshwane. Limpopo (397; 14%) and Mpumalanga (319; 12%) were also substantially affected, while the remaining five provinces together reported 443 cases (16%) (Figure 5).24 Confirmed cases increased steadily throughout the year, exceeding 2 289 by epidemiological week 48 and prompting a national catch-up measles vaccination campaign between 3 and 28 November 2025. Case numbers continued to increase thereafter, although at a slower rate, reaching 2 756 confirmed cases by the end of the year.24
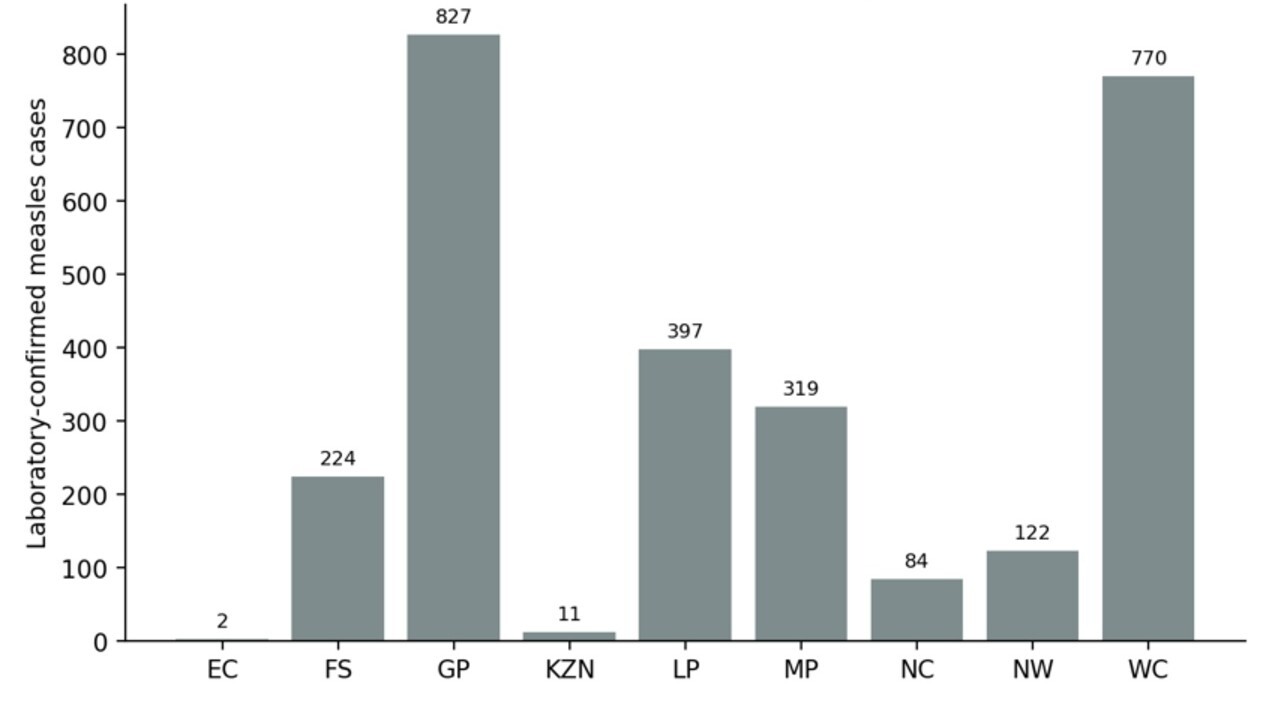
Figure 5.Laboratory-confirmed measles cases, South Africa, 2025 (n = 2 756)
Source: National Institute for Communicable Diseases. 2026.24
The outbreak occurred in the context of suboptimal population immunity. Measles transmission was concentrated in areas with low vaccination coverage, consistent with the immunisation gap described in the Child Health section of this paper, where full immunisation coverage among children aged under one year remained at 75.1%, well below the national target of 90%. Although several factors influence outbreak dynamics, the resurgence highlights the consequences of persistent immunity gaps for highly transmissible vaccine-preventable diseases.
Concurrently, there were 2 091 laboratory-confirmed rubella cases reported nationally. Unlike measles, however, transmission was concentrated in North West province, which accounted for 1 225 cases (59%). The contrasting geographic distributions of two clinically similar diseases underscore the importance of laboratory confirmation and virological surveillance for distinguishing co-circulating pathogens and accurately characterising outbreak patterns.24 Wastewater surveillance provided an additional source of evidence, detecting measles virus predominantly in Gauteng, independently supporting the geographic distribution observed through clinical and laboratory surveillance.
Respiratory diphtheria remained an important vaccine-preventable disease requiring continued surveillance during 2024 and 2025. Between 1 January 2024 and 28 December 2025, the NICD confirmed 87 cases of respiratory diphtheria, together with two probable cases and 60 asymptomatic carriers identified through contact tracing.25 Most confirmed cases (72%) occurred in the Western Cape, and the overall case-fatality ratio among probable and confirmed cases was 19%, highlighting the continued potential for severe disease despite the relatively small number of reported cases.
Several other high-consequence communicable diseases continued to require national surveillance despite relatively few reported cases. In 2025, the NICD confirmed 15 mpox cases, most of which occurred in Gauteng (8) and KwaZulu-Natal (5), with single cases reported in North West and the Western Cape.26 Human rabies remained rare but highly lethal, with 10 laboratory-confirmed cases reported during the year, comprising four cases in Limpopo, three in the Eastern Cape and three in KwaZulu-Natal.27 Continued surveillance of these diseases remains essential for early outbreak detection, rapid public health response and monitoring of diseases with potentially severe public health consequences despite their low incidence.
Sexually transmitted infections
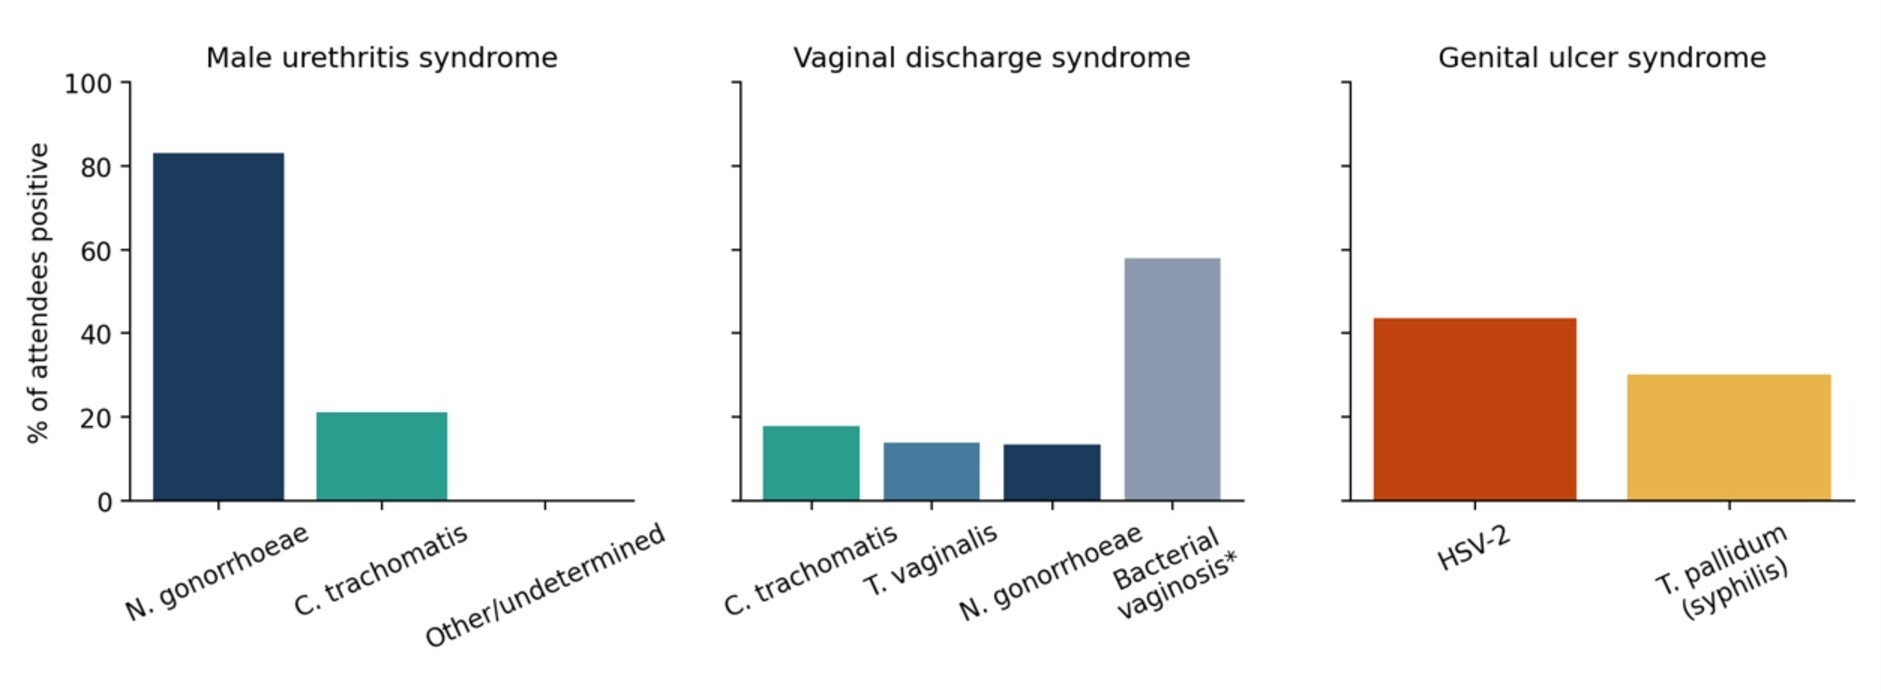
Because syndromic management remains the standard approach to STI care in South Africa, aetiological surveillance relies on sentinel surveillance rather than routine pathogen-specific reporting. Between 2021 and 2024, 3 265 attendees were enrolled at sentinel surveillance sites in Gauteng, KwaZulu-Natal and the Western Cape.28 The distribution of pathogens differed by clinical syndrome (Figure 6). Neisseria gonorrhoeae was the predominant cause of male urethritis syndrome, bacterial vaginosis was identified in more than half of women presenting with vaginal discharge, together with Chlamydia trachomatis, Trichomonas vaginalis and gonorrhoea, while genital ulcer syndrome was caused predominantly by herpes simplex virus type 2 and syphilis.28
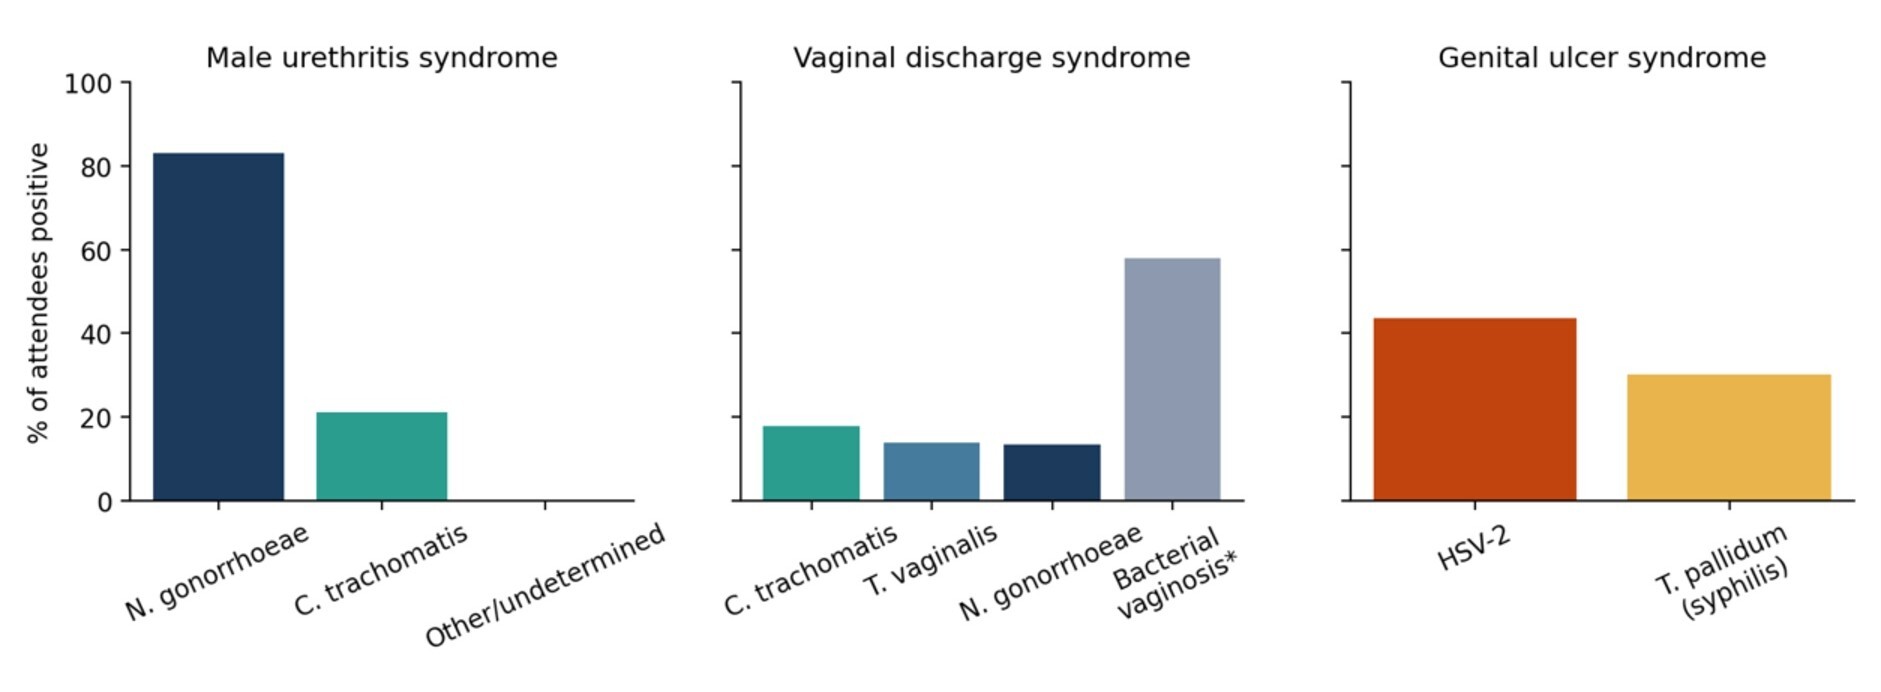
Figure 6.Leading causes of STI syndromes at sentinel sites, South Africa, 2021–2024
Source: Kufa et al., 2025.28
Surveillance also documented increasing antimicrobial resistance in N. gonorrhoeae. The proportion of azithromycin-resistant isolates increased from 0.8% in Gauteng in 2021 to 4.2% across Gauteng and KwaZulu-Natal in 2024, representing more than a fivefold increase over three years.29 Although resistance remained uncommon, the upward trend highlights the importance of continued antimicrobial resistance surveillance to inform national STI treatment guidelines.
Antimicrobial resistance
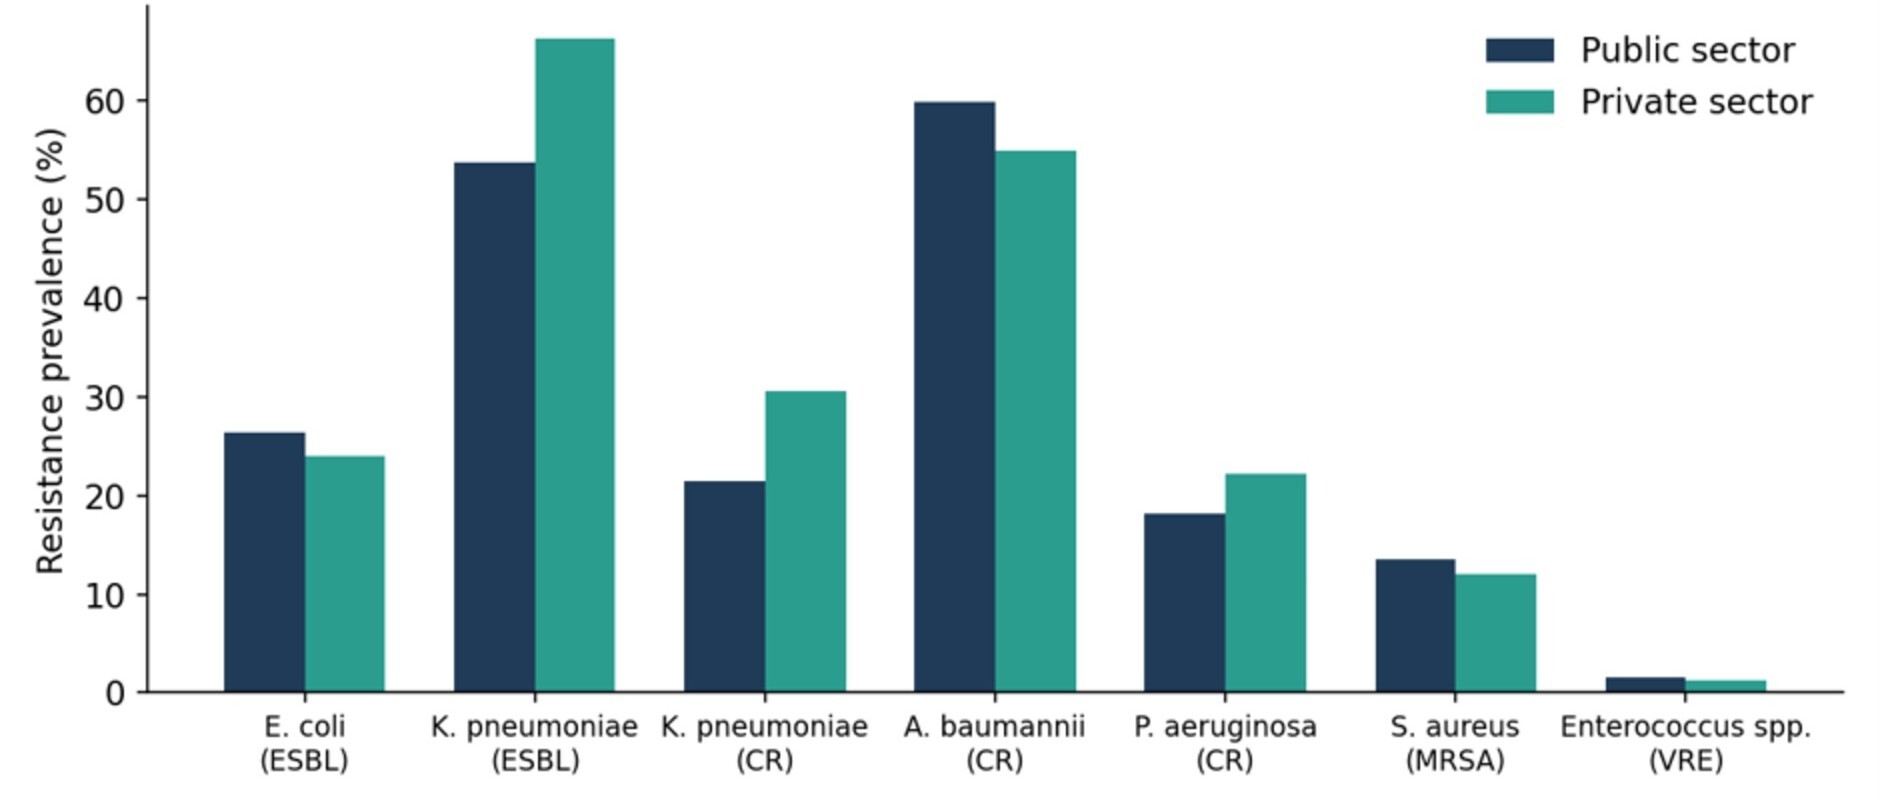
South Africa has established national antimicrobial resistance (AMR) surveillance through a collaboration between the NICD and the South African Society for Clinical Microbiology, with microbiology laboratories from both the public and private sectors contributing to a common surveillance platform using standardised definitions. This provides one of the few directly comparable measures of healthcare-associated infection across the two sectors. Surveillance in 2024 showed high levels of resistance among several WHO priority ESKAPE bloodstream pathogens (Figure 7). Extended-spectrum beta-lactamase (ESBL) production in Klebsiella pneumoniae exceeded 50% in both sectors and reached 66.3% among private sector isolates, while carbapenem-resistant Acinetobacter baumannii accounted for more than half of all bloodstream isolates in both sectors. Resistance was generally similar across sectors, although prevalence was higher in private sector isolates for several organisms. Together, these findings indicate that resistance among major healthcare-associated bacterial pathogens remains well established across South Africa’s health system.29,30
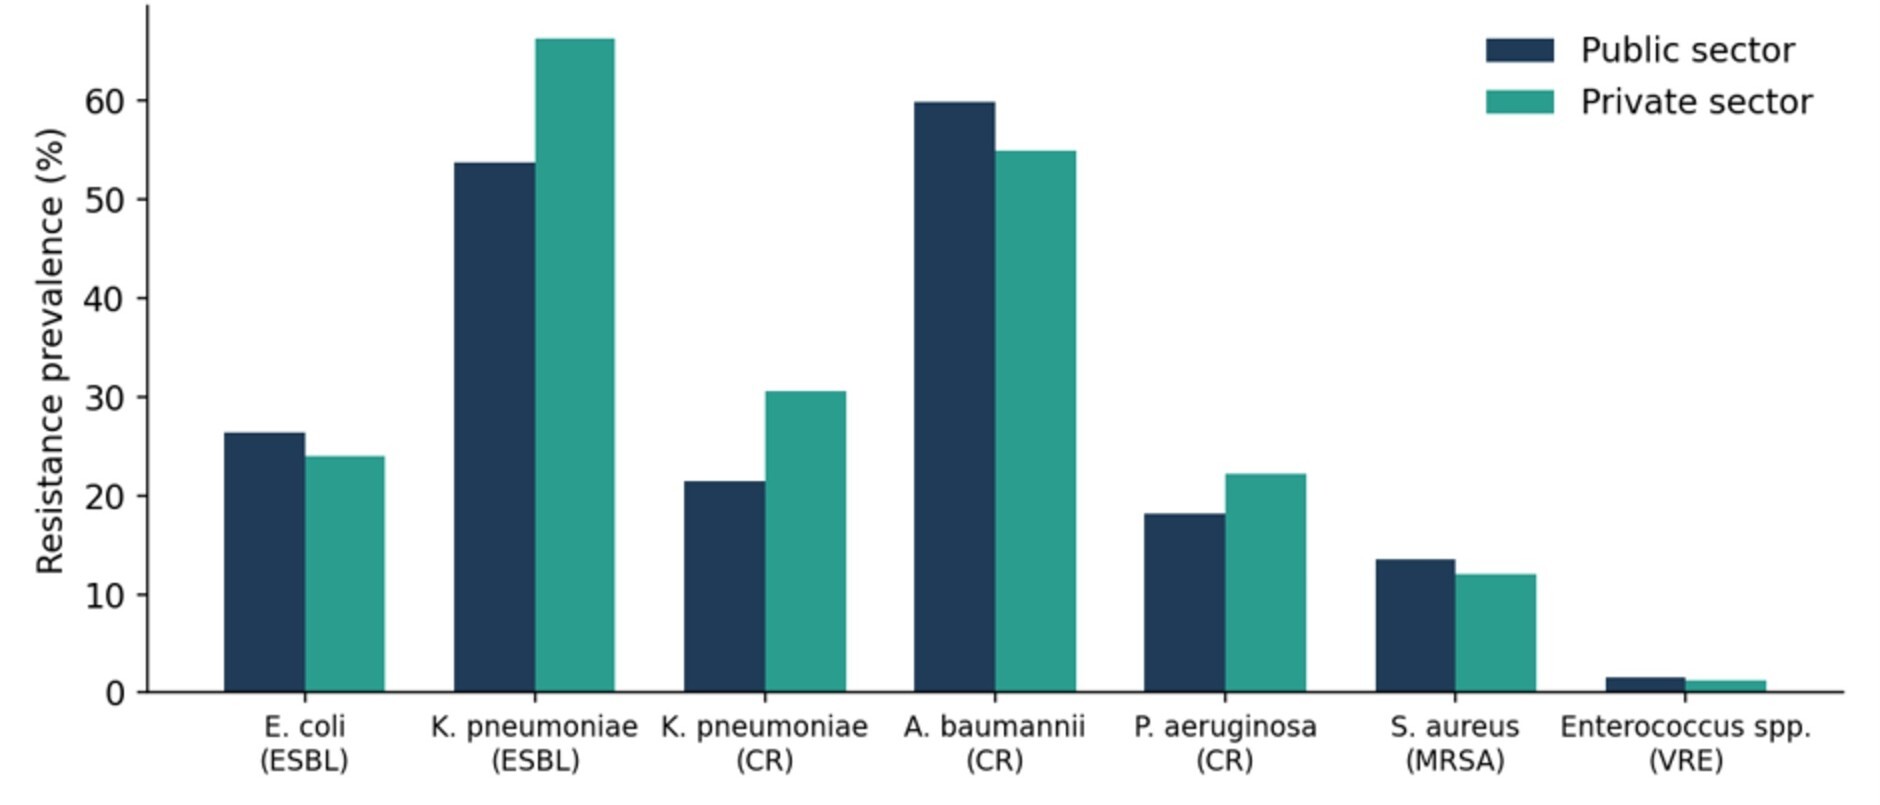
Figure 7.Resistance prevalence among ESKAPE bloodstream pathogens, South Africa, 2024
Source: National Institute for Communicable Diseases, 2026.29
The NICD Multi-Drug-Resistant Organisms Dashboard recorded a national incidence rate of 23.8 per 100 000 population in 2025, with Gauteng reporting the highest provincial burden.28 Candidozyma auris (formerly Candida auris), a multidrug-resistant fungal pathogen associated with healthcare-associated outbreaks, is now endemic in more than 100 South African hospitals. Together with the increasing azithromycin resistance observed in Neisseria gonorrhoeae (see STI section), these findings indicate that antimicrobial resistance remains an expanding threat across bacterial and fungal pathogens.
Policy development has not kept pace with the surveillance evidence. South Africa’s National Strategy Framework on Antimicrobial Resistance, which covered the period 2014–2024, expired at the end of 2024 and had not been replaced at the time of writing, despite AMR being identified as one of the 19 technical areas in the National Action Plan for Health Security.29,30 Surveillance also remains focused largely on healthcare facilities. Routine surveillance of antimicrobial resistance in community settings, animal health and the environment is limited, leaving important gaps in the implementation of a comprehensive One Health surveillance approach. South Africa also contributes antimicrobial consumption data to the WHO Global Antimicrobial Resistance and Use Surveillance System (GLASS), but private sector reporting remains incomplete, so national consumption estimates understate total use.
Malaria
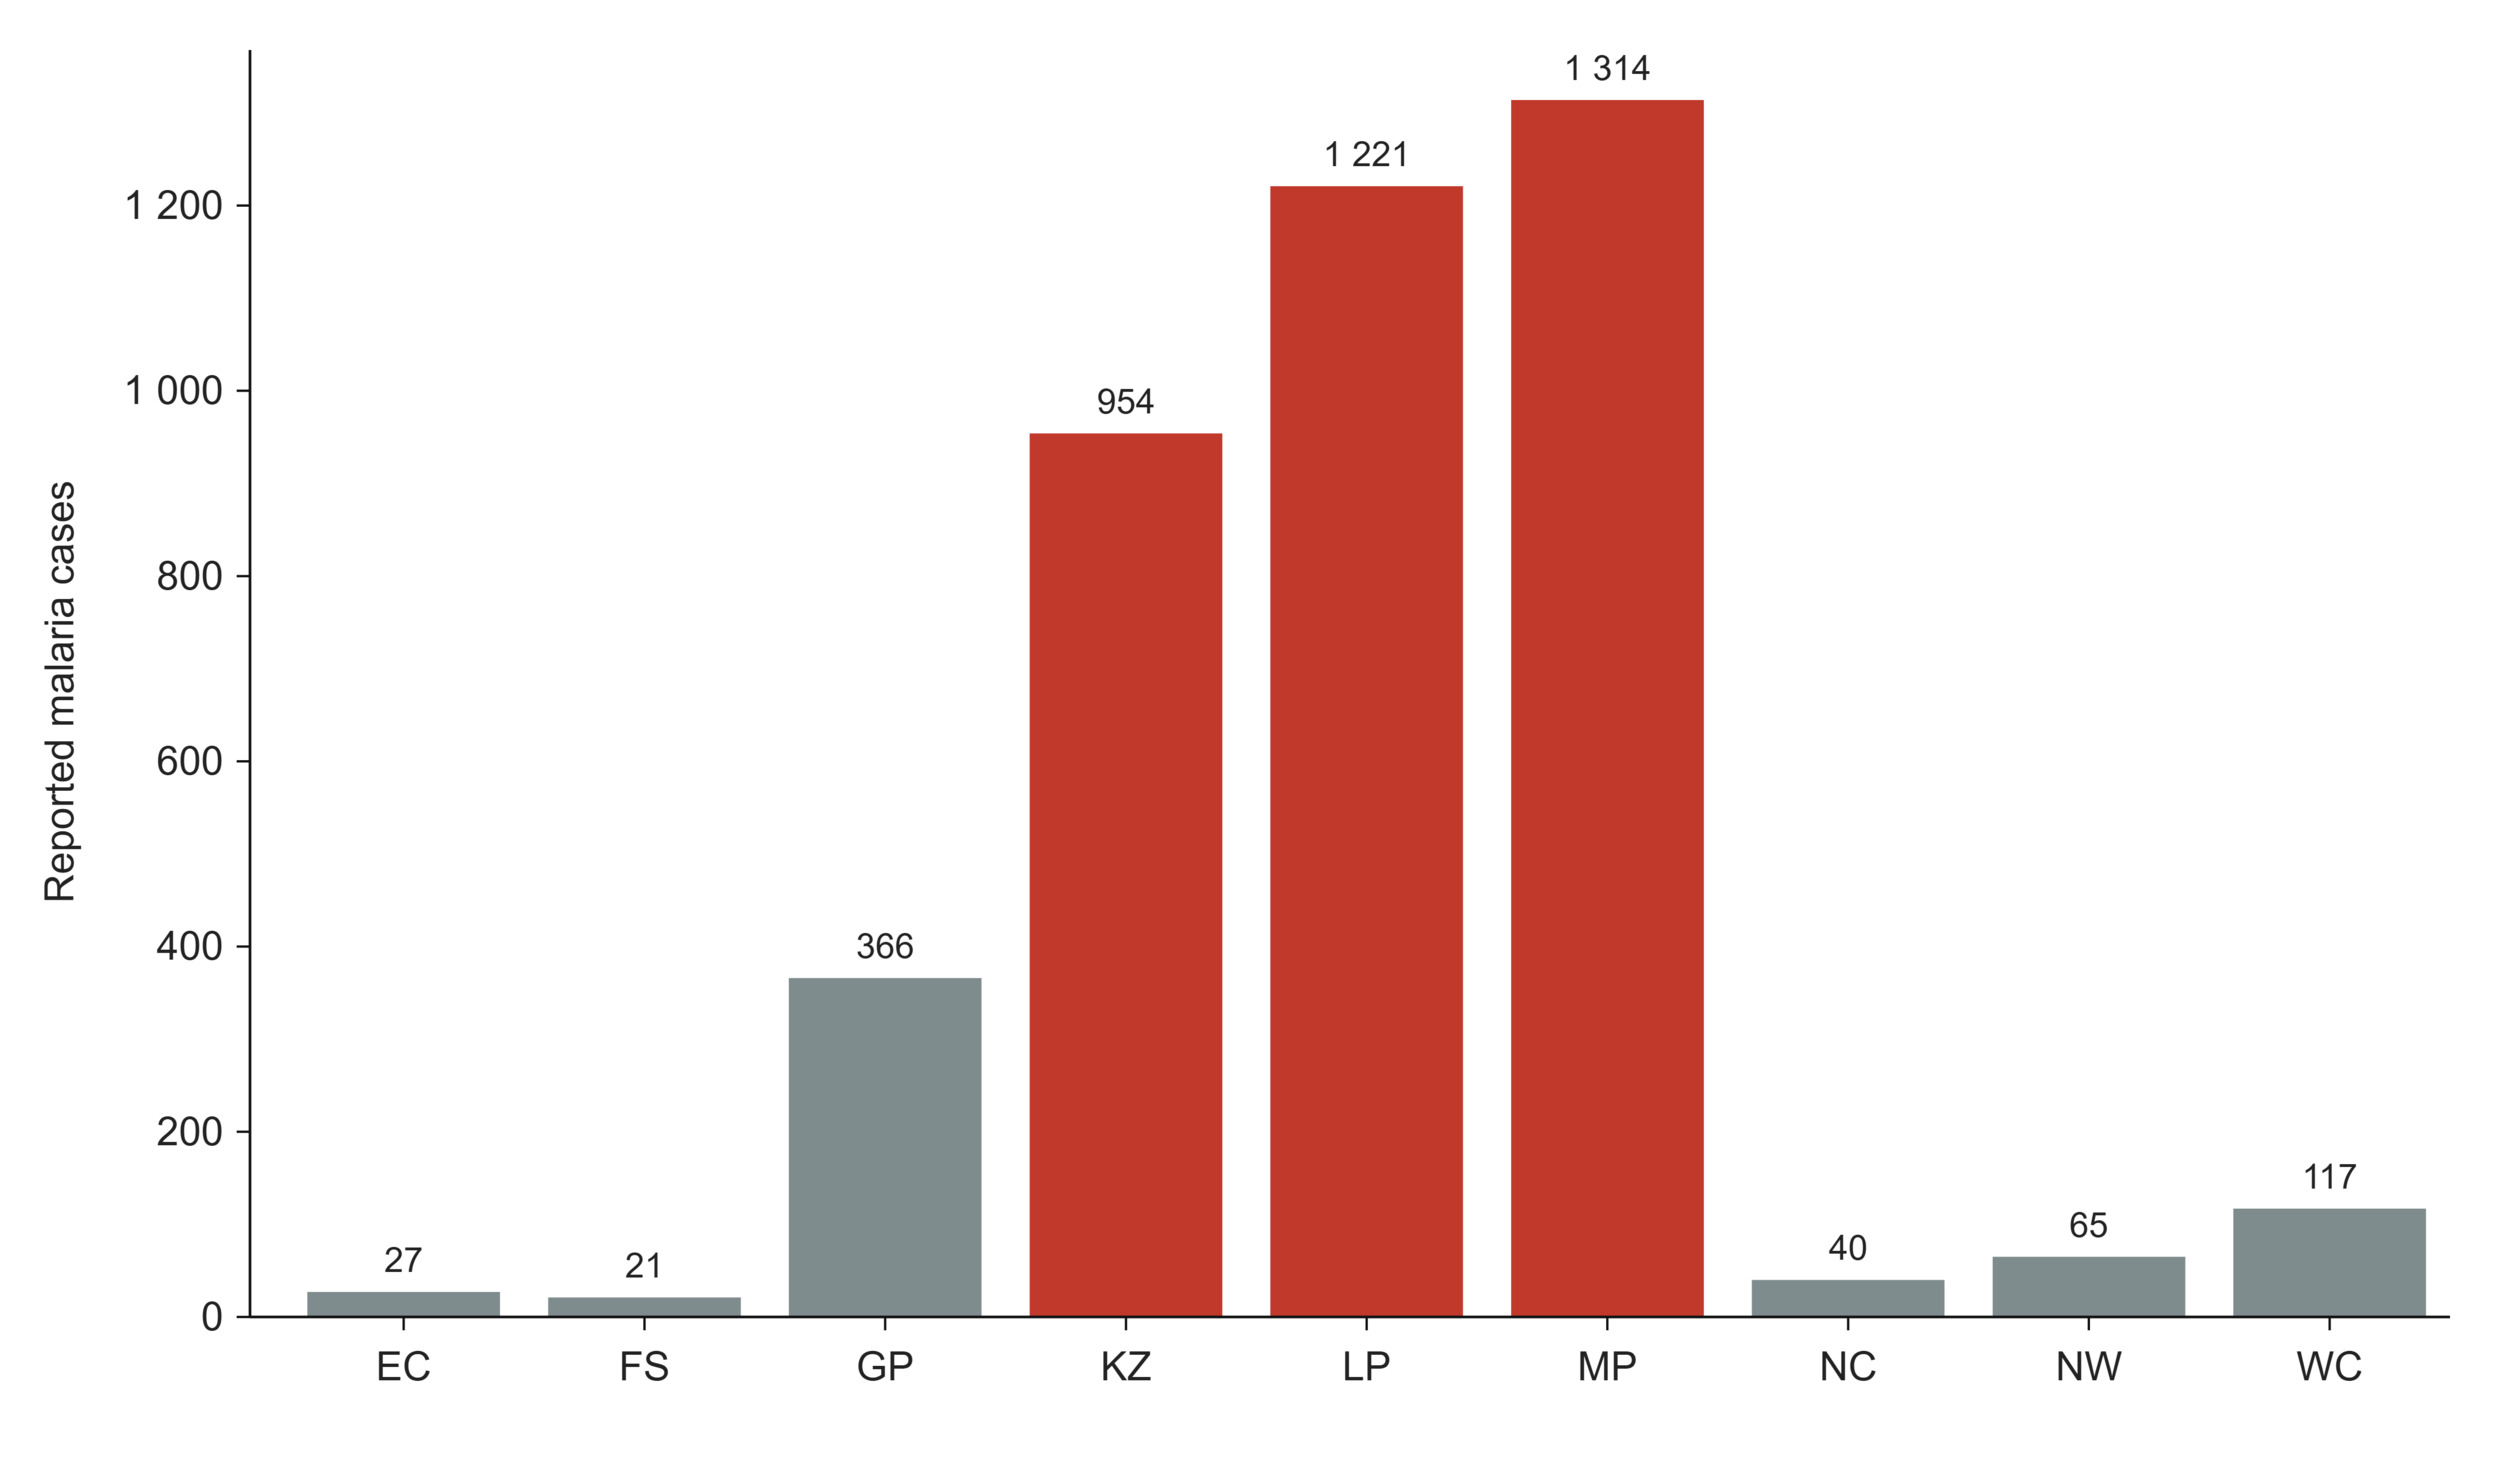
Malaria transmission in South Africa remains confined to low-altitude districts of KwaZulu-Natal, Limpopo and Mpumalanga. South Africa’s National Malaria Elimination Strategy aims to interrupt local malaria transmission by 2029/30. National estimates of malaria burden differ according to the surveillance system used. The WHO estimated 740 malaria cases and 10 deaths in 2024, whereas the DHIS recorded 4 125 cases and 27 deaths during the 2024/25 financial year (Figure 8). These estimates are not directly comparable because they are derived using different surveillance and reporting methodologies.31,32
Most DHIS-reported cases occurred in Mpumalanga (1 314), Limpopo (1 221) and KwaZulu-Natal (954). The remaining six provinces, none of which have endemic malaria transmission, together reported 636 cases, most of which were travel-related. These cases are reported through the Notifiable Medical Conditions surveillance system, which covers the non-endemic provinces that fall outside the malaria programme’s case reporting. Malaria deaths are likewise not confined to the endemic provinces: recorded deaths in Gauteng exceed those in KwaZulu-Natal, consistent with late presentation of imported infection where clinical suspicion is lower. In October 2025, the NICD investigated a cluster of three odyssean malaria cases in the Free State involving patients with no travel history.33 Although uncommon, such cases highlight the importance of maintaining clinical vigilance and surveillance capacity beyond malaria-endemic areas, particularly as South Africa progresses towards malaria elimination.
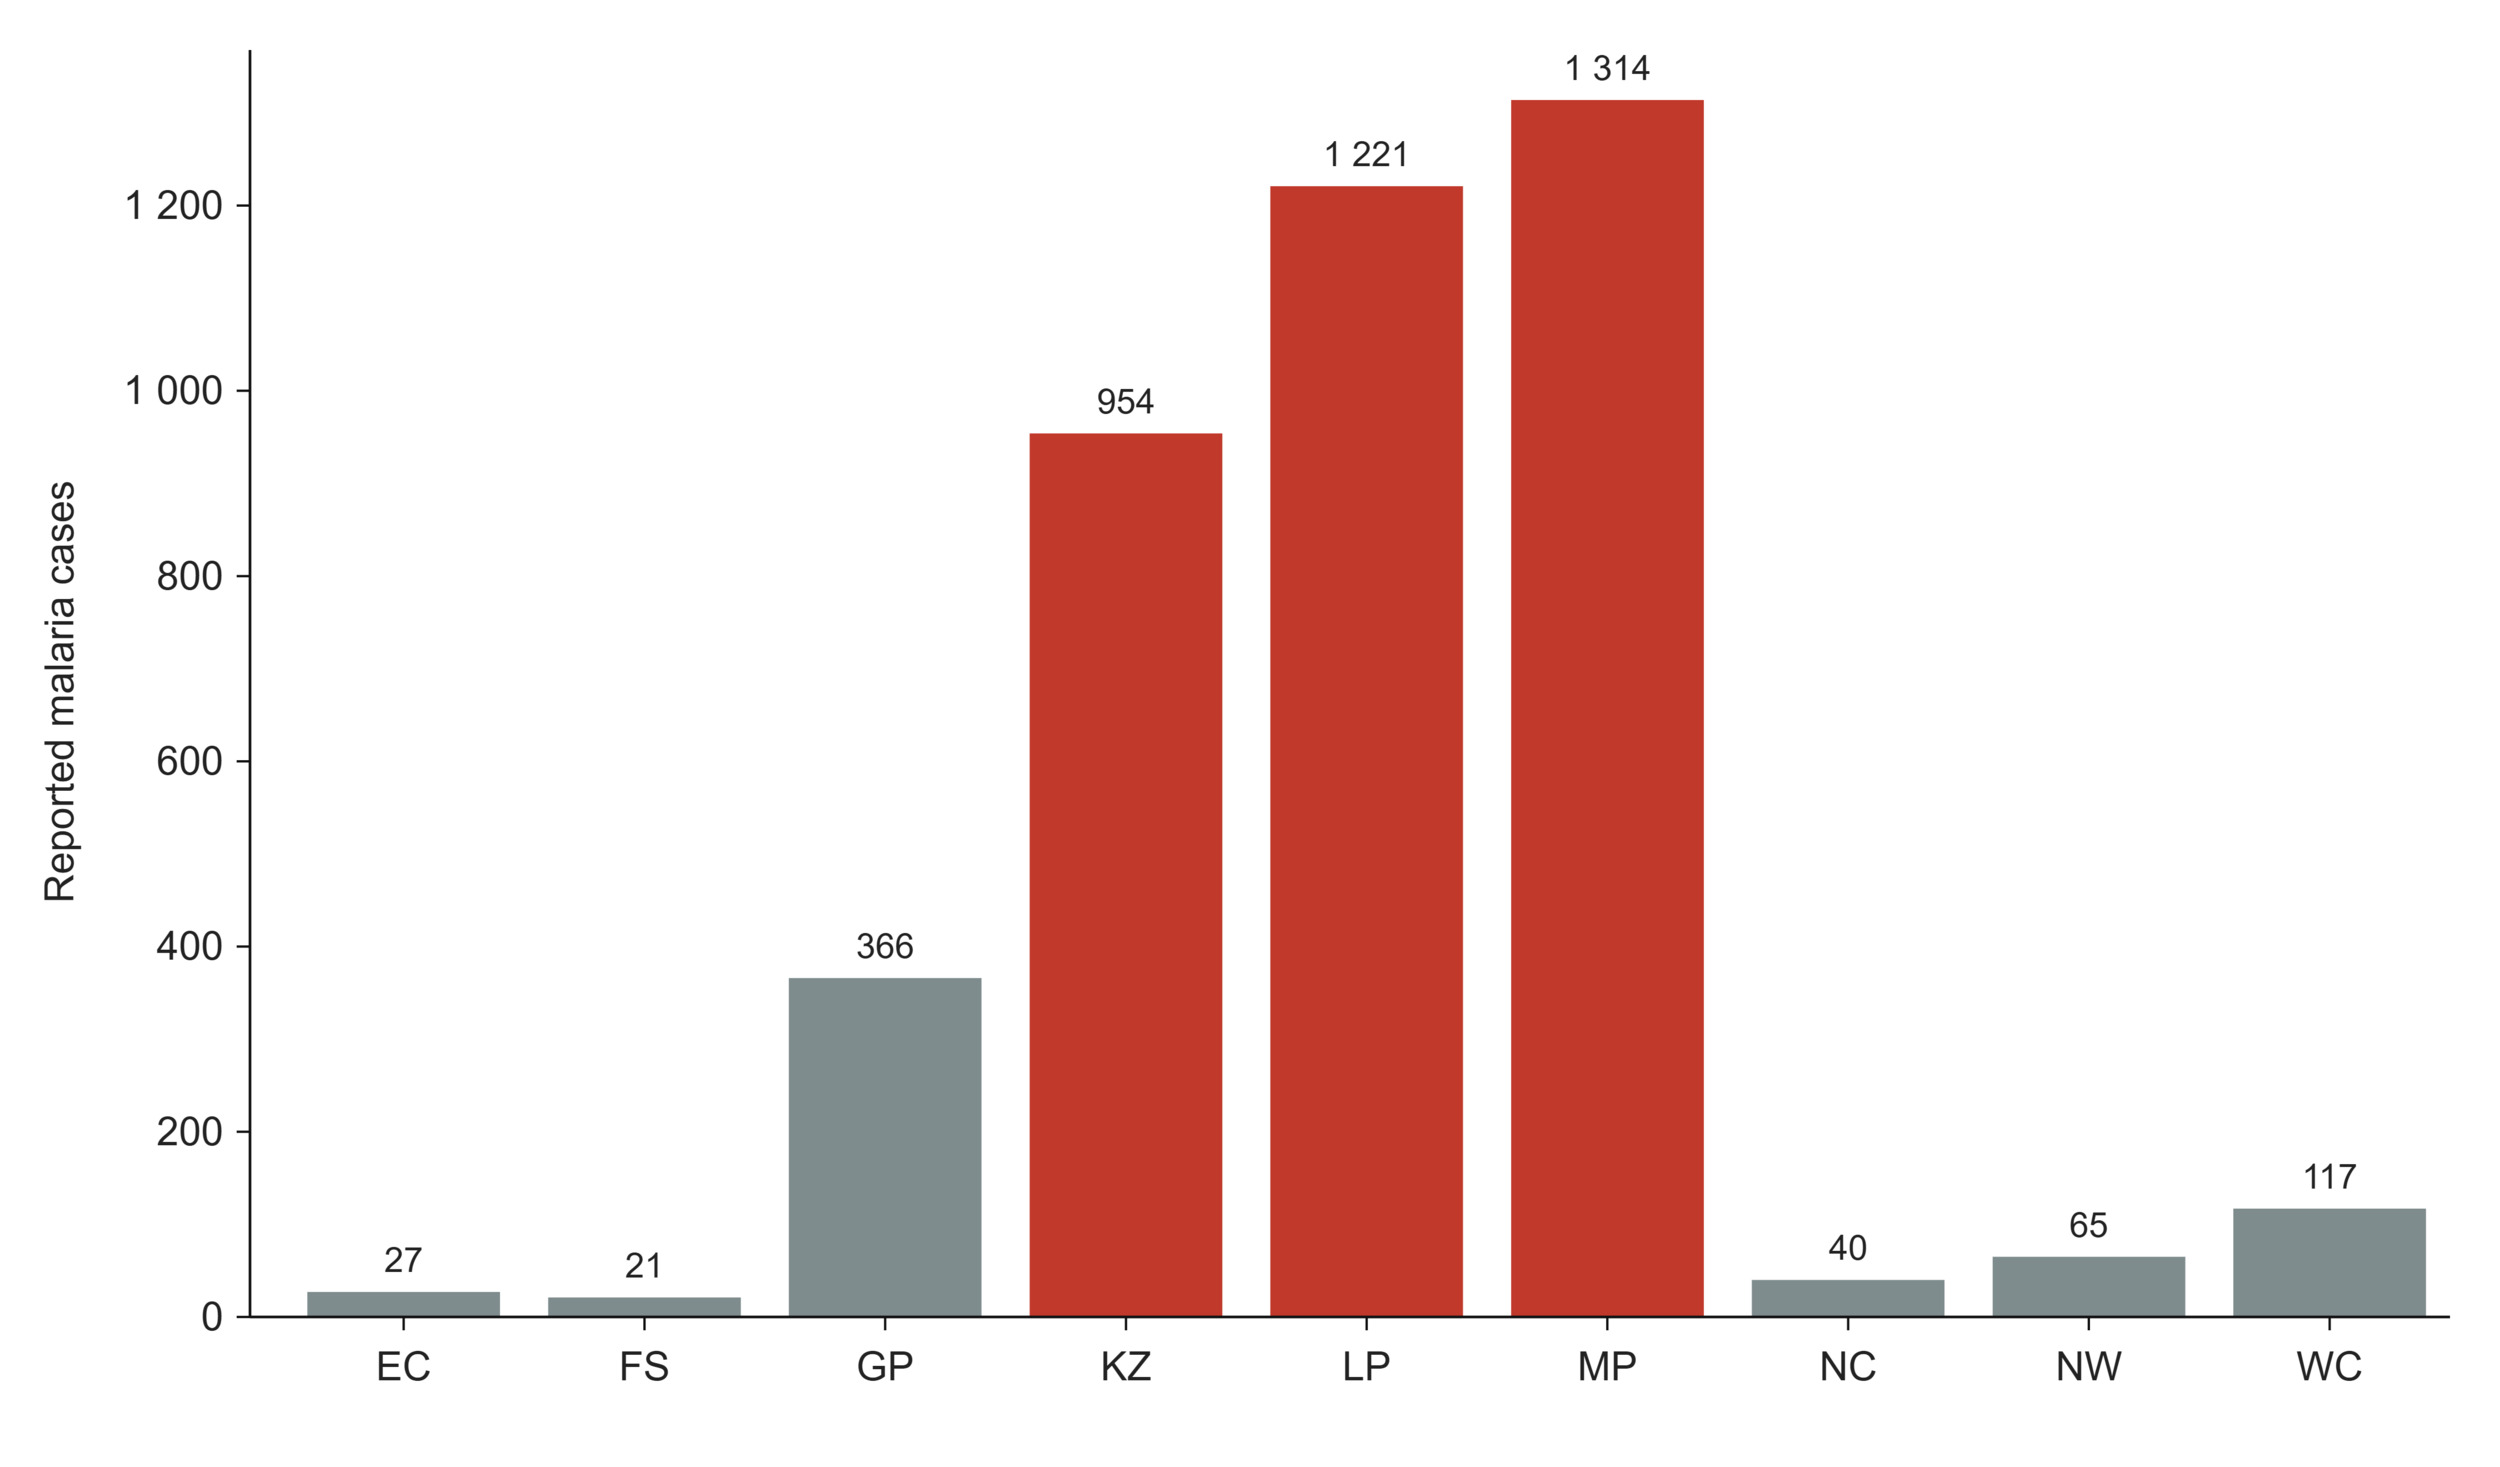
Figure 8.Malaria cases by province, South Africa, 2024/25 (n = 4 125)
Source: National Institute for Communicable Diseases, 2025.34
Respiratory viruses
Sentinel surveillance conducted through public outpatient and inpatient sites provides year-round monitoring of influenza, respiratory syncytial virus (RSV), SARS-CoV-2 and pertussis. During the 2024 respiratory virus season, 7 169 specimens collected between 1 January and 17 November were tested, with influenza (13.9%) and RSV (11.9%) accounting for most laboratory-confirmed detections, followed by SARS-CoV-2 (6.5%) and Bordetella pertussis (1.2%). Influenza activity peaked in epidemiological week 23, driven primarily by influenza A(H1N1) pdm09, with a smaller second peak in week 35 associated with influenza B/Victoria. RSV activity peaked earlier, in week 16, and both seasonal epidemics had ended by week 41.35
Learning signals: communicable diseases
What does the data reveal? Beyond HIV and TB, communicable disease surveillance during 2024 and 2025 identified multiple concurrent public health signals rather than a single dominant threat. These included a large measles outbreak that resulted in 2 756 laboratory-confirmed cases during 2025, a sustained resurgence of invasive meningococcal disease following the COVID-19 pandemic, increasing azithromycin resistance in Neisseria gonorrhoeae, continued high levels of antimicrobial resistance among priority bacterial pathogens, and ongoing progress towards malaria elimination despite sporadic unusual events requiring investigation outside endemic areas. Taken together, these findings demonstrate the value of complementary surveillance platforms in detecting and characterising diverse communicable disease threats across South Africa.
Is the system responding? Several surveillance findings translated into public health action. The 2025 measles outbreak prompted a national catch-up vaccination campaign, while increasing meningococcal disease activity triggered clinician alerts before case numbers reached their current level. GERMS-SA expanded surveillance to include neglected tropical diseases for the first time, and national AMR surveillance now integrates microbiology data from both the public and private sectors using standardised methods, providing one of the country's few truly cross-sector surveillance systems.
What prevents learning? The principal constraint is the resilience of the surveillance system itself. The June 2024 cyberattack on the NHLS disrupted automated laboratory reporting and delayed surveillance outputs for several months, demonstrating the dependence of national communicable disease surveillance on robust digital and laboratory infrastructure. Important policy gaps also remain. South Africa's national AMR action plan expired at the end of 2024 without a successor, despite surveillance documenting persistently high resistance among several priority pathogens. Surveillance coverage is also uneven: pathogen-specific STI surveillance and several AMR programmes rely on sentinel sites rather than national reporting, limiting comparisons across provinces. Finally, the measles outbreak highlighted a broader challenge for the health system. Declining childhood immunisation coverage had already signalled increasing population susceptibility before widespread transmission occurred, raising the question of whether surveillance findings are consistently translated into preventive action before outbreaks emerge. |
Table 3.Communicable diseases
| Indicator |
Period |
SA |
EC |
FS |
GP |
KZ |
LP |
MP |
NC |
NW |
WC |
Reported cases of cholera
NICDa |
2025 |
4 |
18 |
|
|
|
|
|
|
|
|
| WHOa |
2024 |
13 |
18 |
|
|
|
|
|
|
|
|
Reported cases of cholera (per 100 000)
WHOa |
2.5 |
18 |
|
|
|
|
|
|
|
|
Reported deaths from cholera
WHOa |
2024 |
0 |
18 |
|
|
|
|
|
|
|
|
Reported cases of malaria
all ages WHOb |
2024 |
740 |
22 |
|
|
|
|
|
|
|
|
| DHISc |
2024/25 |
4 125 |
27 |
21 |
366 |
954 |
1 221 |
1 314 |
40 |
65 |
117 |
Reported deaths from malaria
all ages WHOb |
2024 |
10 |
22 |
|
|
|
|
|
|
|
|
| DHISc |
2024/25 |
27 |
0 |
0 |
3 |
9 |
7 |
5 |
1 |
1 |
1 |
Reported cases of measles
NICD lab diagnosedd |
2025 |
2 788 |
3 |
222 |
801 |
12 |
398 |
317 |
104 |
121 |
810 |
Reported cases of rubella
NICD lab diagnosedd |
2025 |
2 091 |
8 |
154 |
119 |
19 |
83 |
211 |
202 |
1 225 |
70 |
Reported cases of respiratory diphtheria
NICDd |
2024/25 |
87 |
0 |
0 |
4 |
3 |
9 |
8 |
0 |
0 |
63 |
Reported cases of invasive meningococcal disease
NICDd |
2024 |
150 |
25 |
5 |
39 |
8 |
3 |
0 |
7 |
2 |
61 |
Reported cases of invasive meningococcal disease (per 100 000)
NICDd |
2024 |
0.24 |
0.35 |
0.16 |
0.24 |
0.06 |
0.05 |
0.00 |
0.51 |
0.05 |
0.81 |
Reported cases of mpox
NICD confirmedd |
2025 |
15 |
0 |
0 |
8 |
5 |
0 |
0 |
0 |
1 |
1 |
Reported cases of human rabies
NICD confirmedd |
2025 |
10 |
3 |
0 |
0 |
3 |
4 |
0 |
0 |
0 |
0 |
Multi-Drug Resistant Organisms Incidence Rate
NICD publicd |
2025 |
23.8 |
2.0 |
1.4 |
10.7 |
4.0 |
1.0 |
1.9 |
0.2 |
1.3 |
1.4 |
Percentage of bloodstream infection due to Escherichia coli resistant to 3rd-generation cephalosporin (%)
NICDd |
2023 |
35.4 |
|
|
|
|
|
|
|
|
|
Percentage of bloodstream infections due methicillin-resistant Staphylococcus aureus (%)
NICDd |
2023 |
17.8 |
|
|
|
|
|
|
|
|
|
REFERENCE NOTES
a Global Cholera Dashboard
b World Malaria 2025
c DHIS
d NICD Dashboard
DEFINITIONS
Case fatality rate: cholera [Percentage] — Number of deaths divided by number of cases expressed as a percentage.
Multi-drug resistant organisms incidence rate [per 100 000 population] — The number of laboratory-confirmed cases of infection with multi-drug-resistant organisms - bacterial and fungal pathogens that have developed resistance to multiple classes of antimicrobial agents, principally the ESKAPE group (Enterococcus faecium, Staphylococcus aureus, Klebsiella pneumoniae, Acinetobacter baumannii, Pseudomonas aeruginosa, Enterobacter species) and Candida/Candidozyma species. The indicator draws on routinely collected bloodstream infection data from both public and private sector pathology laboratories, reported through the NICD’s Antimicrobial Resistance Surveillance Dashboard, and is used to track the overall burden of drug-resistant healthcare-associated and community-onset infections at national and provincial level.
Percentage of bloodstream infection due to Escherichia coli resistant to 3rd-generation cephalosporin [Percentage] — The percentage of patients with a laboratory-confirmed bloodstream infection due to Escherichia coli, and a susceptibility test result for third-generation cephalosporins, whose isolate was resistant. Reported through the WHO Global Antimicrobial Resistance and Use Surveillance System (GLASS); one of the two organism-antibiotic combinations used for Sustainable Development Goal indicator 3.d.2.
Percentage of bloodstream infections due methicillin-resistant Staphylococcus aureus [Percentage] — The percentage of patients with a laboratory-confirmed bloodstream infection due to Staphylococcus aureus, and a susceptibility test result for methicillin (tested with cefoxitin or oxacillin), whose isolate was methicillin resistant (MRSA). Reported through WHO GLASS; the second organism-antibiotic combination used for Sustainable Development Goal indicator 3.d.2.
Reported cases of cholera [Number] — The number of cases of cholera reported to the Department of Health. Since case reporting of notifiable diseases has been incomplete and delayed for several years, the number of laboratory-confirmed cases from NHLS has been included where available, although these would be expected to include only a subset of the total number of notified cases. Note: Since cholera transmission in South Africa is seasonal, occurring primarily in summer, data may be reported by season rather than by calendar year. In this case data labelled 2001/02 season would be data for August 2001 to July 2002. This is one example of the general WHO Core indicator: New cases of IHR-notifiable diseases and other notifiable diseases per year defined as: Number of new confirmed cases of IHR-notifiable diseases (immediately notifiable diseases) and other notifiable diseases (diseases that could cause serious public health impact and could spread rapidly internationally) per year. IHR-notifiable diseases: smallpox, poliomyelitis due to wild type poliovirus, human influenza caused by a new subtype, severe acute respiratory syndrome (SARS). Other notifiable diseases: cholera, pneumonic plague, yellow fever, viral haemorrhagic fevers, West Nile fever, other diseases that are of special national or regional concern (dengue fever, Rift Valley fever, meningococcal disease).
Reported cases of cholera (per 100 000) [per 100 000 population] — The number of cases of cholera reported to the Department of Health per 100 000 population (for the relevant year). Also known as incidence of cholera or ‘Attack rate’.
Reported cases of human rabies — The number of confirmed cases of human rabies reported to the NICD.
Reported cases of invasive meningococcal disease [Number] — The number of laboratory-confirmed cases of invasive meningococcal disease, defined as the isolation or detection of Neisseria meningitidis from a normally sterile site, reported to the NICD through national laboratory-based surveillance (GERMS-SA).
Reported cases of invasive meningococcal disease (per 100 000) [per 100 000 population] — The number of laboratory-confirmed cases of invasive meningococcal disease reported to the NICD per 100 000 population for the relevant year.
Reported cases of malaria [Number] — The number of cases of malaria reported to the Department of Health. Note: Since malaria transmission in South Africa is seasonal, occurring primarily between October to May, data may be reported by season rather than by calendar year. In this case data labelled 2001/02 season would be data for July 2001 to June 2002.
Reported cases of measles [Number] — Number of cases of measles reported to the National Department of Health per year. Since case reporting of notifiable diseases has been so incomplete and delayed for several years, the number of laboratory-confirmed cases from NHLS has been included where available, although these would be expected to include only a subset of the total number of notified cases. This is one example of the general WHO Core indicator: New cases of vaccine-preventable diseases defined as: Number of confirmed new cases of vaccine-preventable diseases that are included in the WHO recommended standards for surveillance of selected vaccine-preventable diseases, and vaccine-preventable diseases reported on the WHO-UNICEF reporting form in a specified time period. Disease (diphtheria, hepatitis B, pertussis, neonatal tetanus, total tetanus, measles, rubella, congenital rubella syndrome, mumps, diarrhoea, pneumonia, Japanese encephalitis, yellow fever).
Reported cases of mpox [Number] — The number of laboratory-confirmed cases of mpox reported to the NICD. Since case reporting of notifiable medical conditions has been incomplete and delayed for several years, laboratory-confirmed cases are expected to include only a subset of all cases occurring.
Reported cases of respiratory diphtheria [Number] — The number of laboratory-confirmed cases of respiratory diphtheria, defined as the isolation of toxigenic Corynebacterium diphtheriae or Corynebacterium ulcerans from a respiratory specimen, reported to the NICD.
Reported cases of rubella [Number] — The number of laboratory-diagnosed cases of rubella reported to the NICD, confirmed by detection of rubella-specific IgM in specimens submitted through case-based febrile rash illness surveillance.
Reported deaths from cholera [Number] — The number of deaths from cholera reported to the Department of Health. Since cholera transmission in South Africa is seasonal, occurring primarily in summer, data may be reported by season rather than by calendar year.
Reported deaths from malaria [Number] — The number of deaths from malaria reported to the Department of Health or recorded in vital registration (ICD-10 codes B50–B54). Since malaria transmission in South Africa is seasonal, occurring primarily between October and May, data may be reported by season rather than by calendar year.
HIV
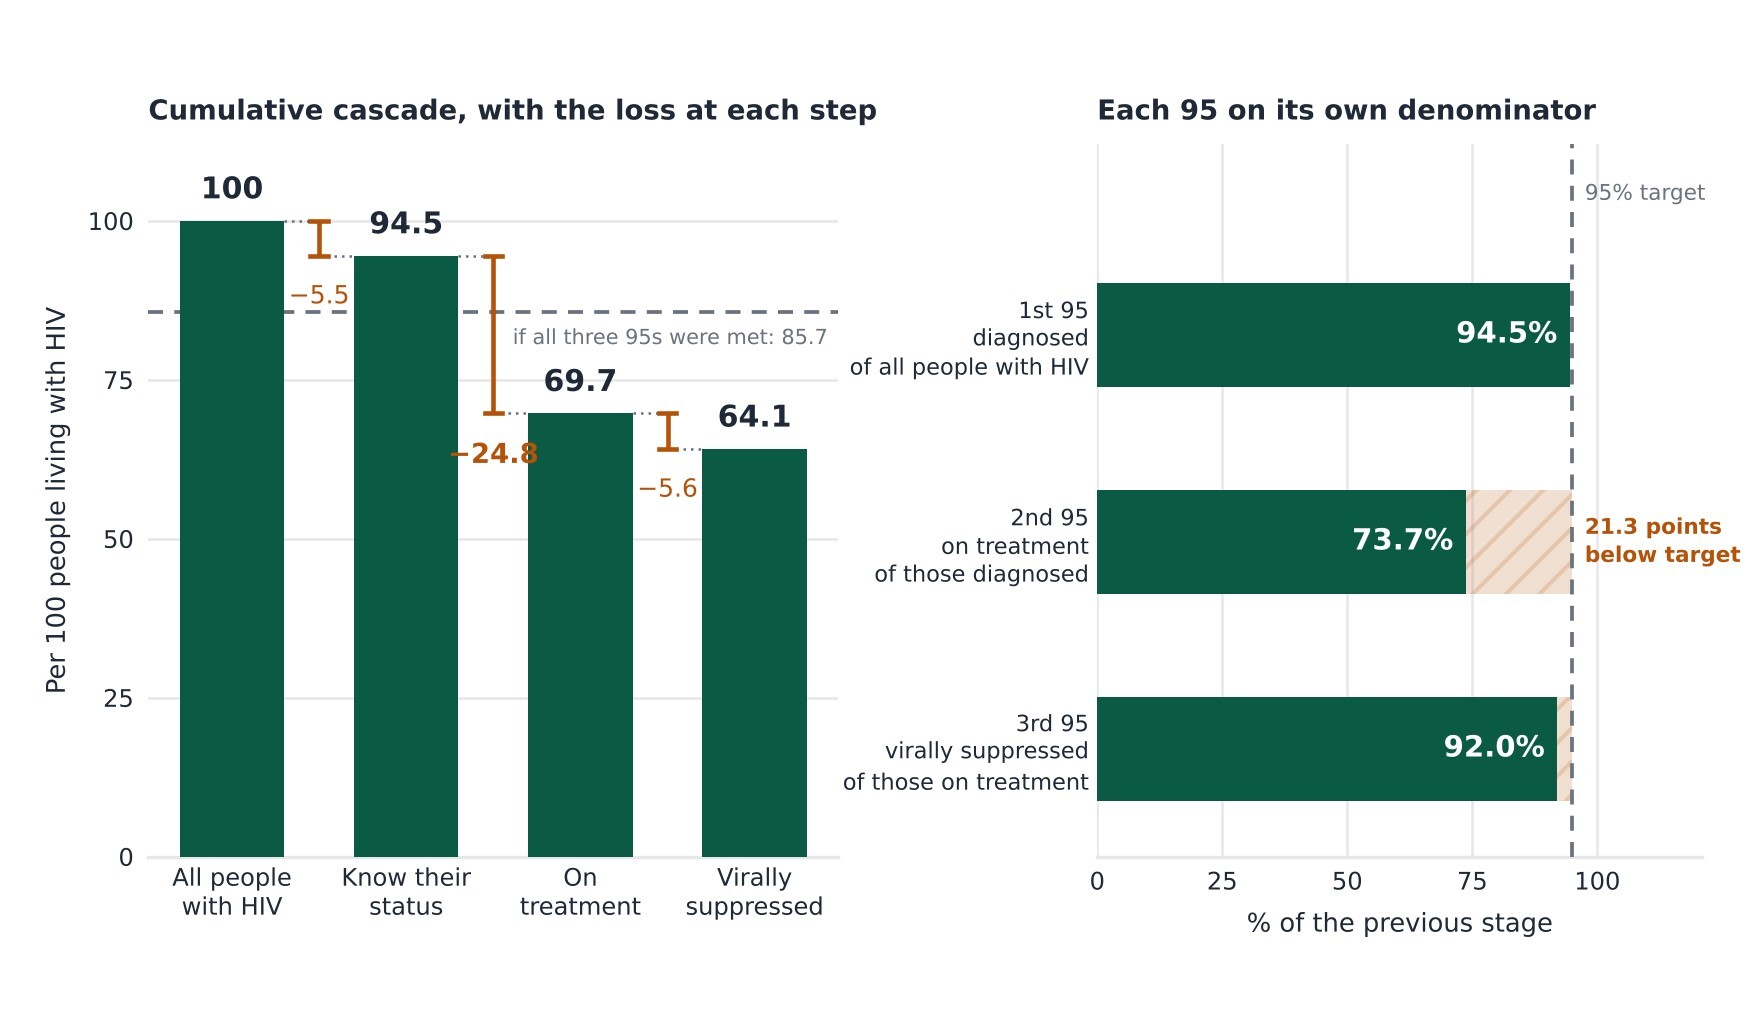
South Africa runs the largest antiretroviral treatment programme in the world, with an estimated 7.86 to 8.06 million people living with HIV in 2025 depending on the source, and around 5.6 million clients recorded as remaining on antiretroviral treatment.32,36,37 Against the UNAIDS 95-95-95 framework, South Africa performs strongly on diagnosis and viral suppression among people receiving treatment but remains substantially behind on treatment coverage. As of the first quarter of 2025, 94.5% of people living with HIV knew their status (the 1st 95), 92% of those on treatment were virally suppressed (the 3rd 95), but only 73.7% of diagnosed people were receiving treatment (the 2nd 95).32 The programme has effectively met two of its three targets while the middle one (the 2nd 95) lags more than twenty percentage points behind (Table 4).
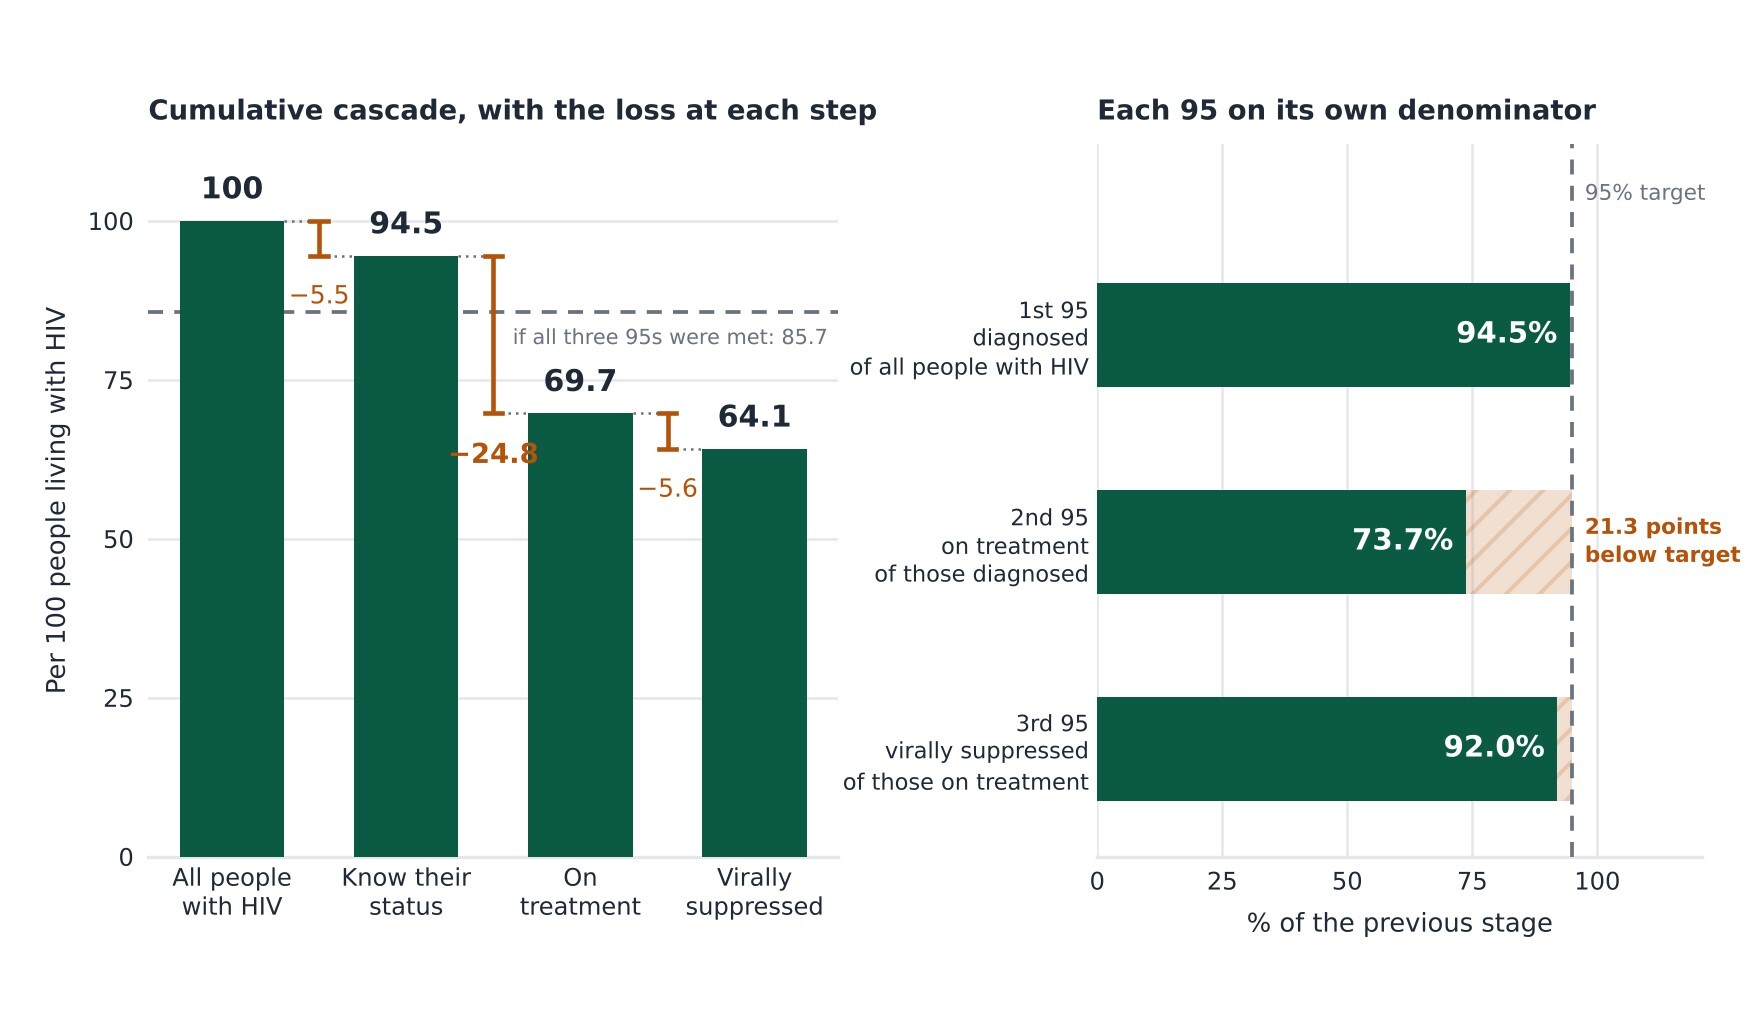
Figure 9.The 95-95-95 cascade, South Africa 2025 Q1
Reading the cascade cumulatively rather than as three independent percentages sharpens the point. The single largest loss along the pathway occurs between diagnosis and being on treatment, and the cumulative effect is that 64.1 of every 100 people living with HIV are virally suppressed, against the 85.7 that meeting all three targets would produce (Figure 9). Aggregate cascade data cannot establish where along that pathway individuals are lost: the gap may reflect delayed initiation, disengagement from care, unrecorded mortality or migration, silent transfers between facilities, or weaknesses in data linkage.37 This is the arithmetic behind the NDoH’s February 2025 launch of a campaign explicitly framed around closing a treatment gap of 1.1 million people who know their status but are not on treatment.38,39 The framing is telling for an SAHR themed on learning because the data reveal precisely where the cascade breaks, and the system has named its response after that number.
However, the bottleneck is not evenly distributed. Provincial ART coverage (the 2nd 95) ranges from 80.1% in KwaZulu-Natal and 78.5% in Mpumalanga down to 65.4% in the Western Cape and 68.3% in Gauteng, an inversion of the usual expectation that better-resourced metropolitan provinces lead.32
The viral suppression among those on treatment who have had a viral load test done, by contrast, sits at 91% to 94% in every province, which tells that therapy works consistently once people are on it. The limited provincial variation in viral suppression among those receiving treatment suggests that the largest differences occur earlier in the cascade, particularly in treatment initiation, coverage, and retention.
Aggregate data cannot, however, exclude differences in case mix, viral-load monitoring completeness or data quality. The retention data reinforces this through the clients remaining on ART rate which averaged 69.7% nationally but fell to 61.4% in the Western Cape and 62.9% in Limpopo, consistent with retention and continuity of care being important contributors to the gap, rather than poor viral suppression among patients who remain in treatment.
A more demanding indicator strips away the reassurance the headline suppression figure offers. Antiretroviral effective coverage, the proportion of all people living with HIV who are both on treatment and virally suppressed, stood at just 51% nationally in early 2025.32 That figure combines the three cascade steps into a single measure of end-to-end performance, and it makes clear that the population-level benefit of the programme is roughly half of what the 92% suppression rate alone might imply.40 The measured figure is also lower than the 64.1% implied by multiplying the three cascade percentages, because effective coverage counts only clients with a documented suppressed viral load. Where a viral load result is missing, the client is not counted as suppressed, so the indicator reflects viral load testing completeness as well as cascade performance.
Effective coverage ranges from 60.7% in KwaZulu-Natal down to 33.3% in the Northern Cape, with the Western Cape’s reported 17% so far below its own cascade components as to signal a data problem rather than genuine performance. In the Western Cape, disaggregating the third 95 separates the two quantities it combines. Viral load suppression among clients tested in the Western Cape stands at 93.1%, the highest in the country, while viral load results are recorded in the routine system for only 29.7% of clients on treatment, the lowest. The Western Cape’s effective coverage therefore measures the completeness of viral load reporting into the national system far more than it measures treatment outcomes. The pattern is consistent across three consecutive years and moves in the opposite direction to service delivery because between 2024 and 2026 the province recorded approximately 85 000 additional clients on treatment while recorded viral load tests fell by 19 000. The Northern Cape shows a less pronounced version of the same divergence (53.9% testing completeness against 91.2% suppression among those tested). Because both provinces contribute to the national denominator, national effective coverage of 51% understates population-level suppression to an unknown degree; excluding these two provinces raises the figure slightly to 53.7%. This is the clearest instance in this paper of an indicator that cannot be read at face value without knowing the completeness of the data behind it.
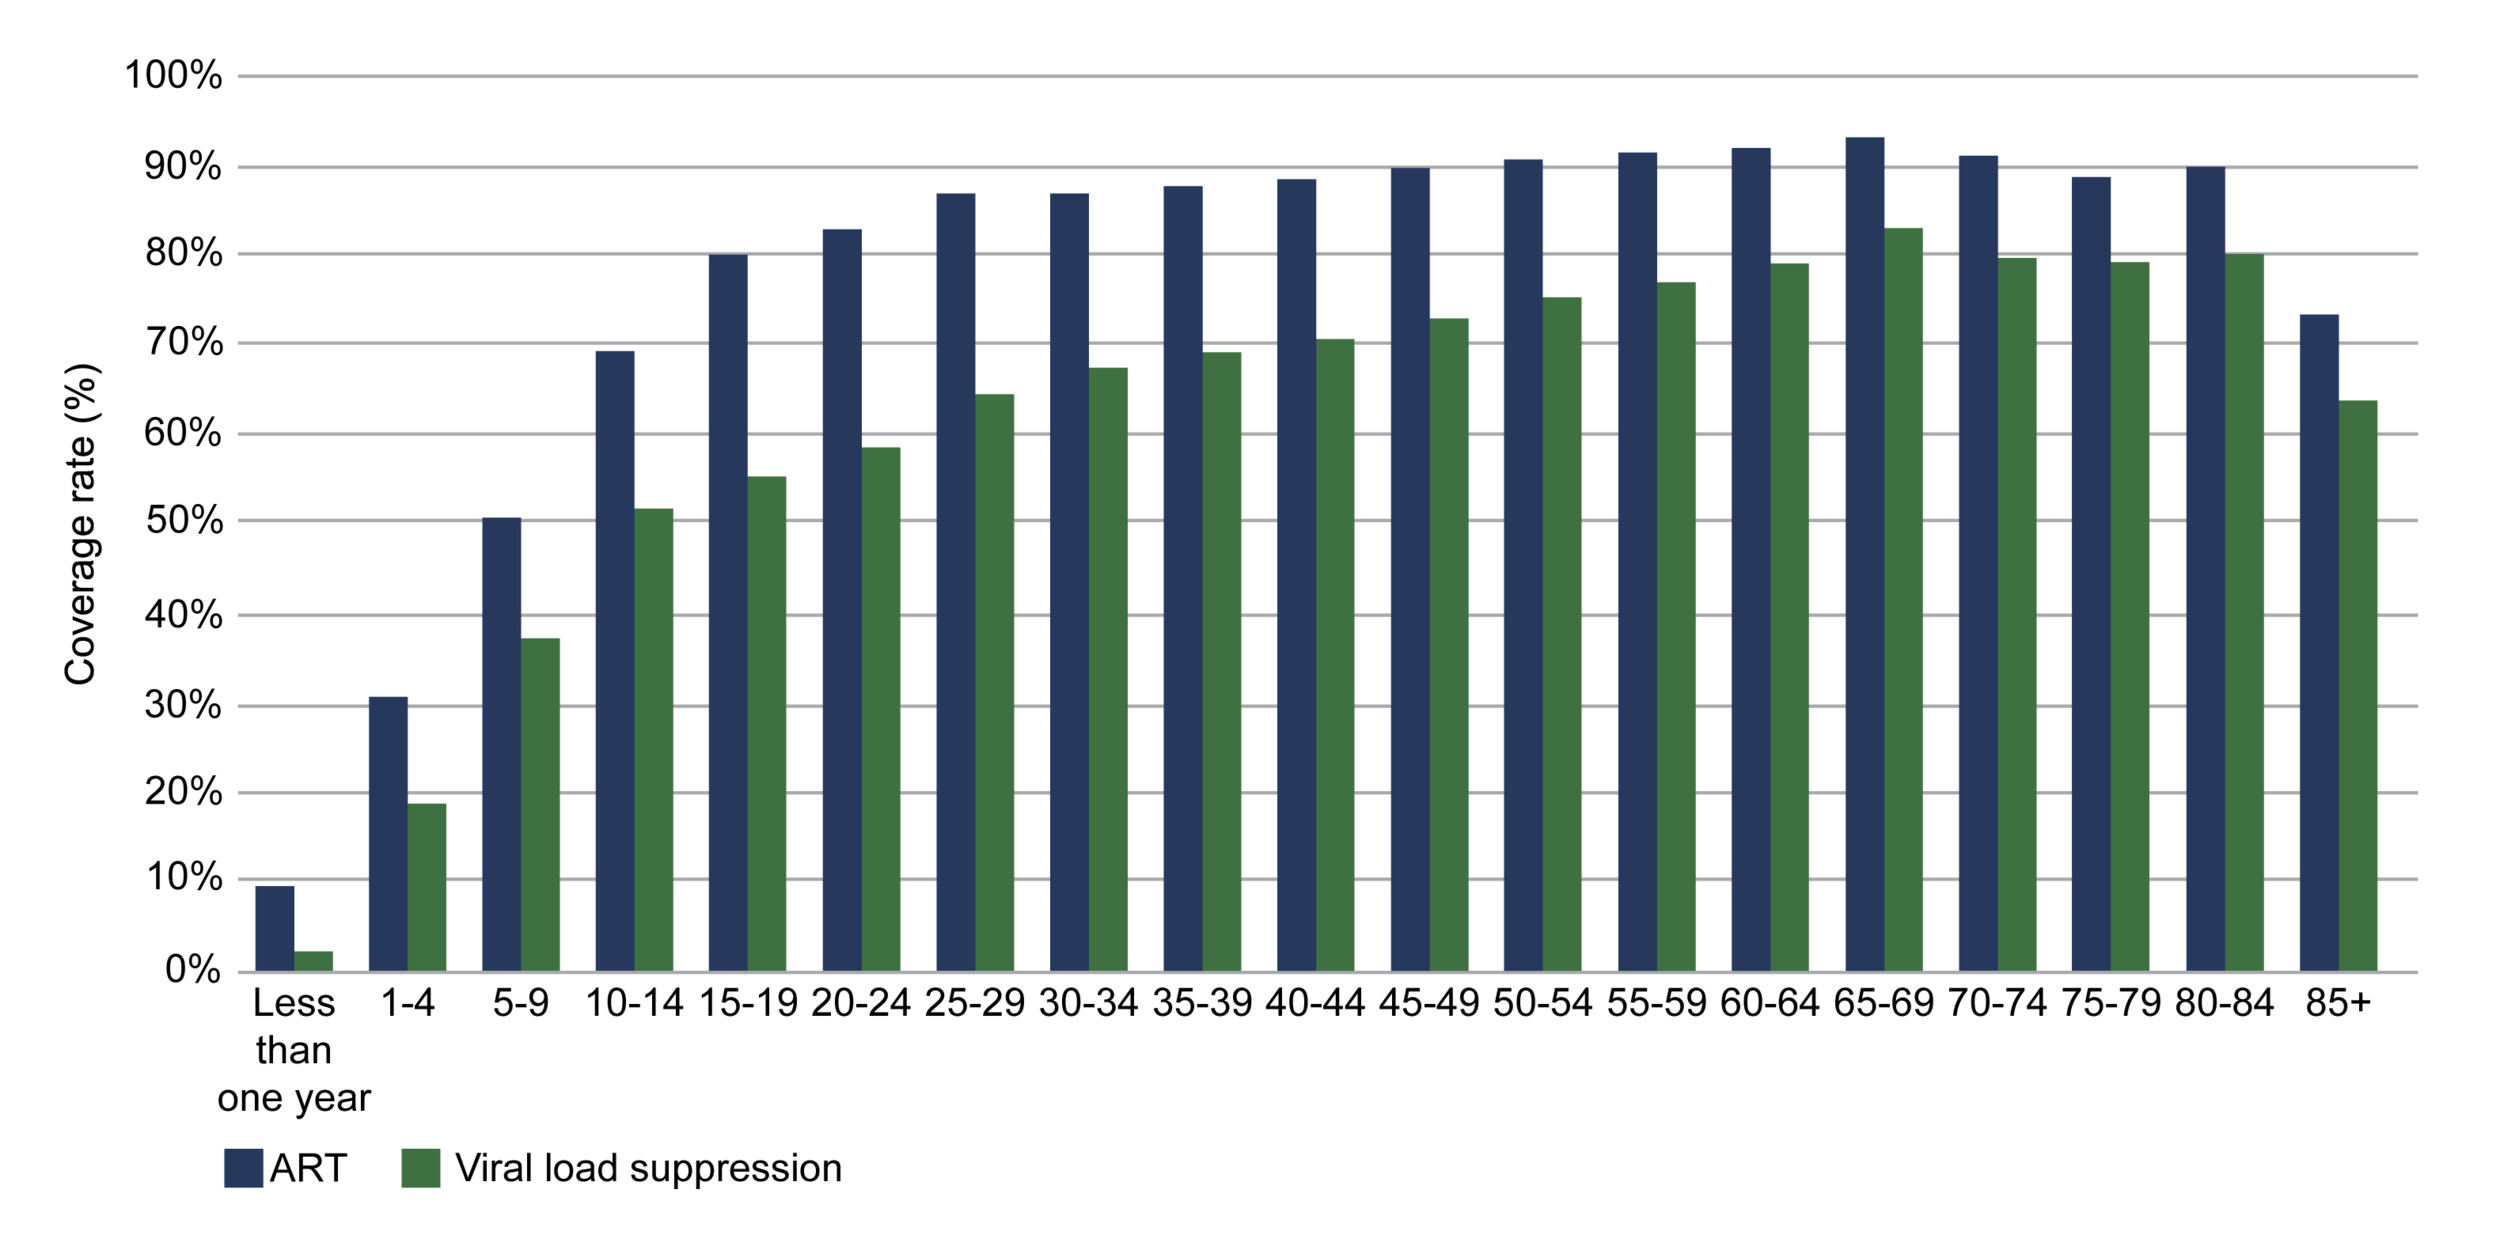
Two groups sit conspicuously behind the national average and children are the clearest. Paediatric ART coverage is estimated at 65.6% against 78.6% for all ages, and viral suppression among children on treatment who have done a viral load test is 73.5% in DHIS and as low as 52% in the UNAIDS global report, well below the adult figure of around 92%.9,32,36 This paediatric lag is well documented in the South African literature, which attributes it to loss to follow-up, virological non-suppression, and adherence difficulties as children approach adolescence.41 Adolescents and young adults are the second group: modelled ART coverage from THEMBISA v5.0 for those aged 15 to 24 is 56.4% nationally, more than twenty points below the all-age rate, and falls below 47% in the Eastern Cape and Limpopo.9 These are the same cohorts flagged in the HIV disease-management analysis of the private sector (HIV data utilisation data collected by CMS in collaboration with SANAC biannually), where the widening gap between treatment and viral load testing was most acute among 15-to-29-year-olds (Figure 10).13 Across public and private data, the cascade measures are weakest for adolescents and young people.
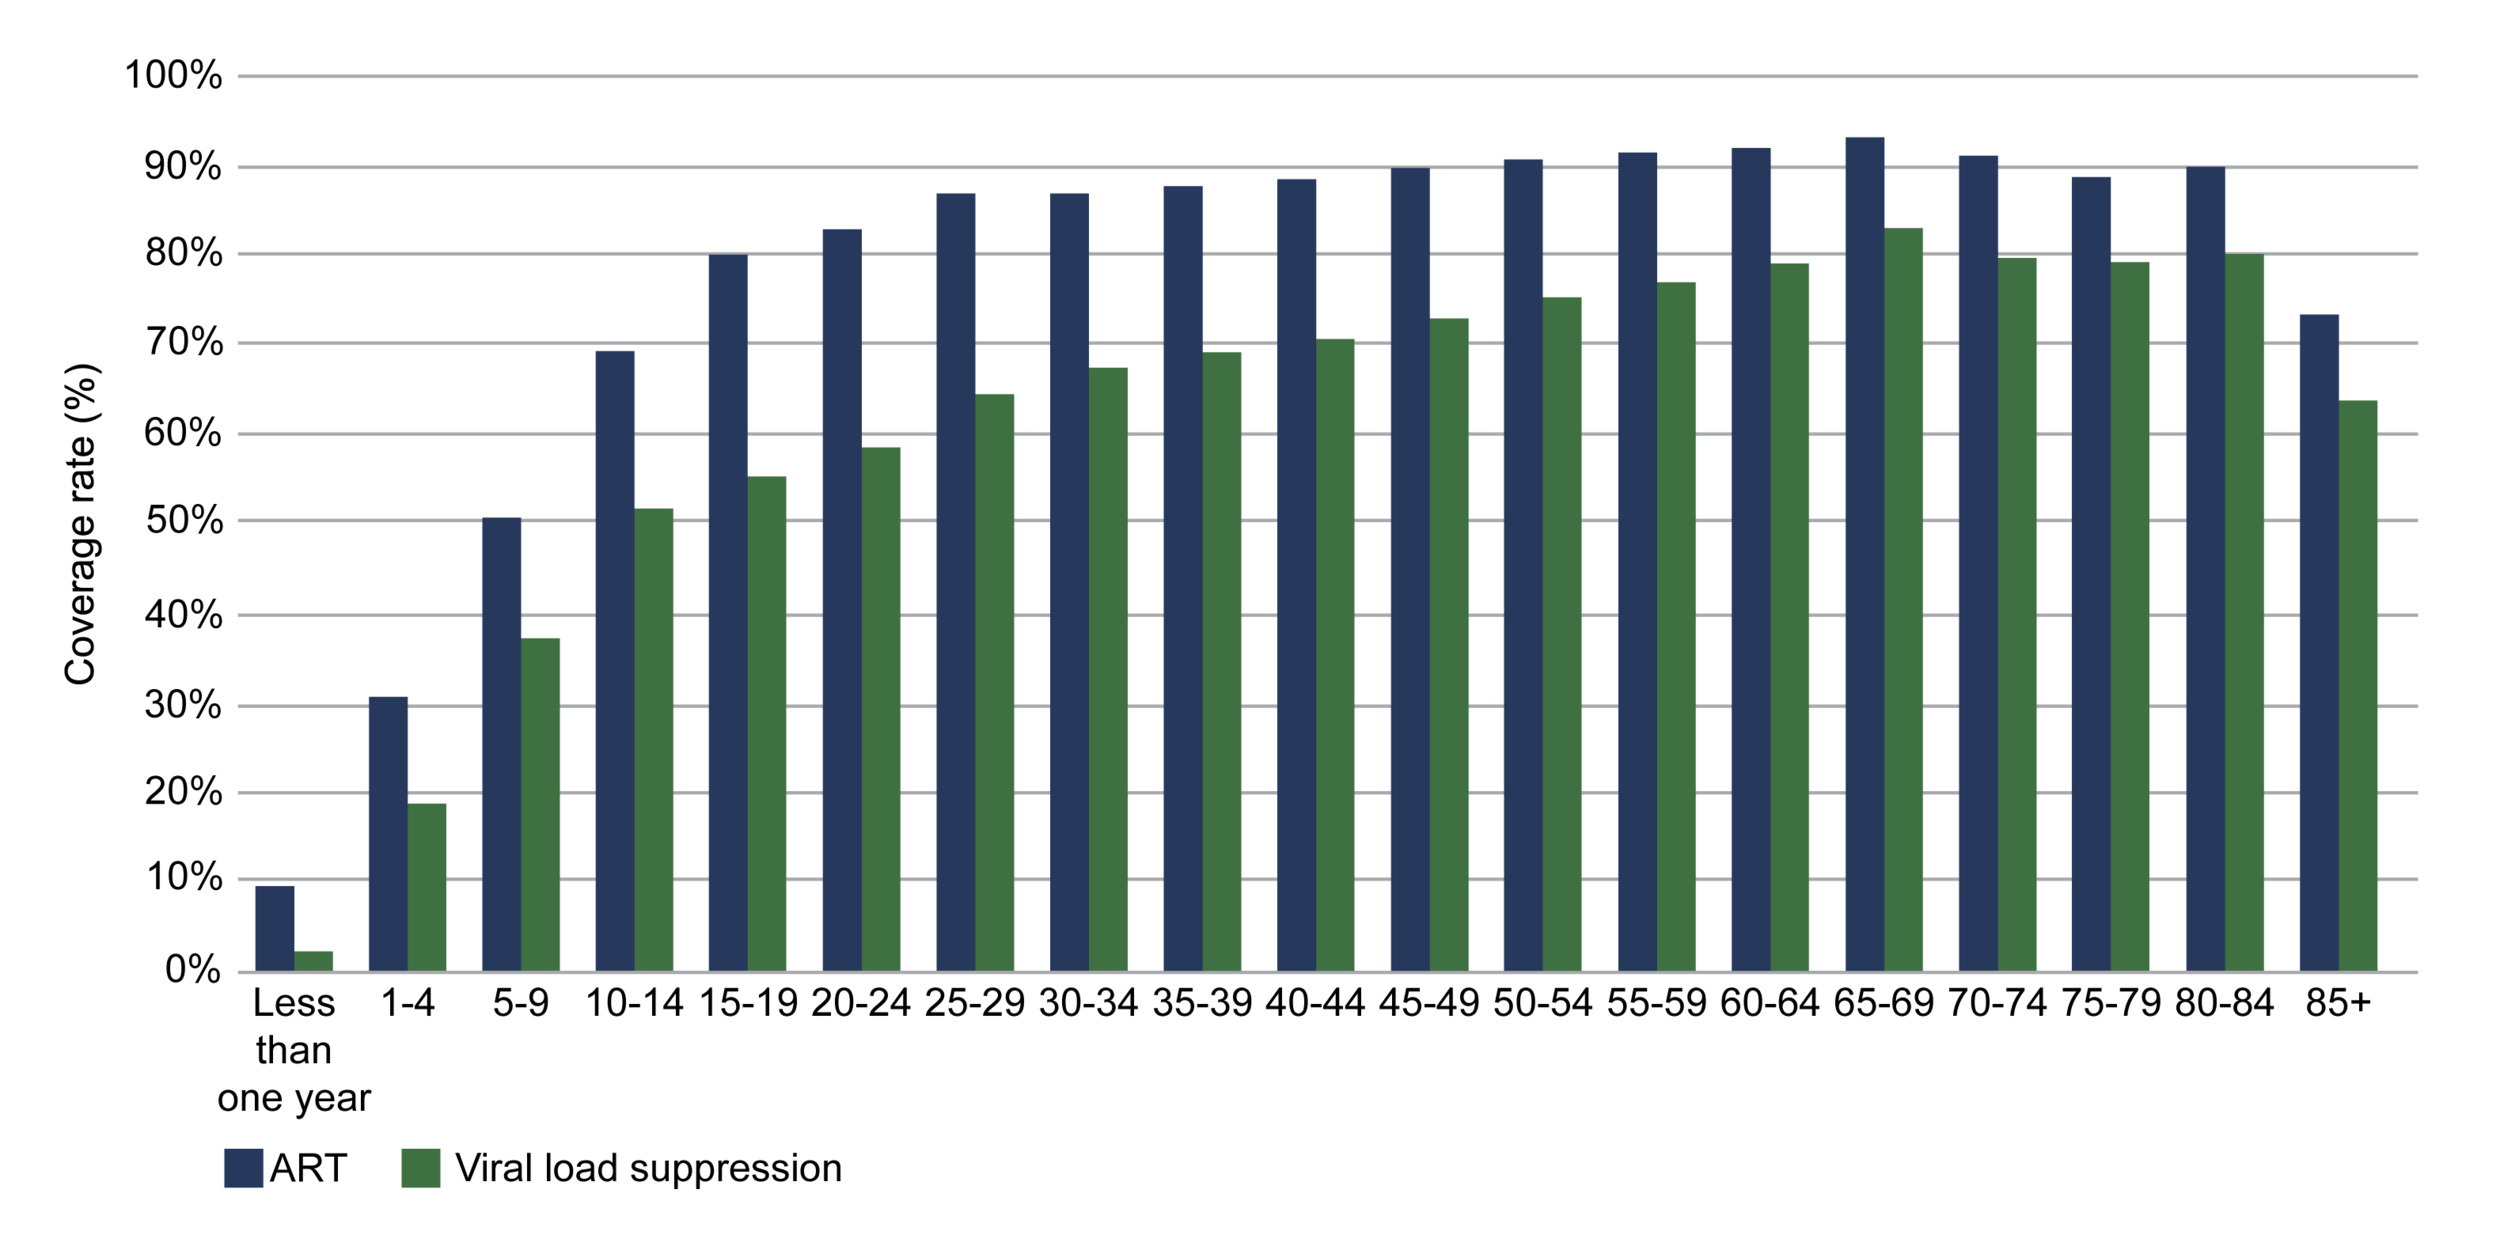
Figure 10.ART-Viral load gap analysis by age groups in 2024
Source: Council for Medical Schemes, 2025.13
Prevention and vertical-transmission indicators are comparatively strong. The antenatal ART initiation rate reached 96.6% nationally, and the infant PCR positivity rate at around ten weeks was 0.37%, a figure that reflects a maturing programme to prevent mother-to-child transmission, though the provincial spread from 0.19% in the Free State to 0.88% in the Northern Cape shows where residual transmission concentrates. Voluntary medical male circumcision (VMMC) coverage among men aged 15 to 49 is estimated at 66.9% and TB/HIV co-infected clients on ART consistently exceed 90% in most provinces, indicating that HIV and TB services are reasonably well integrated at the point of care.9,36
A less visible indicator in this domain records male circumcisions performed by a medical professional within the traditional sector, which totalled 124 643 nationally in 2024/25. The distribution follows cultural geography rather than programme capacity where Mpumalanga accounts for 71 827 of these procedures, followed by KwaZulu-Natal (20 116), the Eastern Cape (12 351) and North West (10 993), while the Western Cape (69) and Northern Cape (105) record very few. The indicator captures the medicalisation of customary initiation, in which clinically trained providers perform the procedure within the initiation setting. Two rationales support this, and both matter for HIV. Traditional circumcision often removes the foreskin only partially, and men who are partially circumcised carry HIV risk comparable to uncircumcised men rather than the reduction demonstrated in the trials underpinning VMMC.42 Medical involvement also addresses the morbidity and mortality documented in the initiation literature, including septicaemia, dehydration, and genital amputation.43 Counts of this kind cannot establish whether either benefit is realised, since the indicator records where a procedure took place rather than its completeness or its outcome, and deaths continue to be reported at registered schools. Read alongside the Customary Initiation Act 2 of 2021, which regulates initiation practice through structures situated outside the health sector,44 it is an indicator that sits at the boundary between the health system and a domain it does not control, and reports volume without visibility of either.45
This picture must now be read against a financing shock that arrived after most of these indicators were recorded. In early 2025 the United States began a phased withdrawal of PEPFAR support, which had accounted for roughly 17% of South Africa’s HIV response and supported more than 15 000 health workers across 27 high-burden districts, even though antiretroviral drug procurement itself was around 90% domestically funded. Modelling published in 2025 estimated that discontinuing PEPFAR-supported services without domestic replacement could produce between 150 000 and 296 000 additional HIV infections and 56 000 to 65 000 additional AIDS-related deaths from 2025 to 2028.46 Although antiretroviral procurement was predominantly domestically financed, the most immediate exposure was concentrated in the service delivery and support functions that connect people to the HIV cascade, including community-based testing and case-finding, treatment support and retention, PrEP delivery, mobile and drop-in services, and data management, which is to say precisely the 2nd 95 machinery this paper identifies as the weakest link. The learning question for consideration is whether the domestic self-reliance response protects that machinery or lets the treatment gap widen.
Learning signals: HIV
What does the data reveal? A programme that has effectively achieved diagnosis and viral suppression but is held back by treatment coverage: the 2nd 95 sits at 73.7% while the 1st and 3rd are at or near target. Children (66% ART coverage) and adolescents and young adults (56% among 15-to-24-year-olds) are the populations the cascade serves least well. Where the cascade thins, it thins by age, and it does so consistently across provinces.
Is the system responding? HIV is one of the clearest examples in this paper of data feeding action. The routine indicators identified the treatment gap with enough precision that the national response was named after it, and the most recent quarter shows the 2nd 95 improving materially. Attribution cannot be established from cascade data alone, but the sequence from measured gap to named campaign, to movement in the measure is the closest this paper comes to observing a full learning cycle in progress. Evidence that the same learning operates sub-nationally was not identified: the provinces with the weakest 2nd 95 and the poorest youth coverage are visible in the data, but no routine mechanism connecting those signals to revised district plans were found in the sources reviewed.
What prevents learning? Two things, and neither is a shortage of data. The first is that the headline indicators quietly blend performance with measurement completeness, so a province can appear to be failing its patients when what is actually failing is the flow of results into the national system. An indicator that behaves this way will mislead any user who does not know to disaggregate it, and nothing in the routine reporting signals the need to. The second is denominator instability, with population-of-PLHIV estimates shifting by several percentage points a year in some provinces for reasons that are methodological rather than epidemiological. Paediatric and adolescent data remain thinner than adult data, precisely where the cascade is weakest. Above all, the 2025 withdrawal of PEPFAR support threatens the community case-finding, retention and data system functions that generate the very signals in this section, a reminder that an LHS depends on financing the machinery of learning, not only the delivery of care. |
Table 4.HIV indicators
| Indicator |
Period |
SA |
EC |
FS |
GP |
KZ |
LP |
MP |
NC |
NW |
WC |
Total living with HIV
DHISa |
2025 Q1 |
8 058 189 |
905 990 |
441 908 |
1 949 046 |
2 034 824 |
741 248 |
777 830 |
109 250 |
556 550 |
541 543 |
People living with HIV (PLHIV)
both sexes 0-14 years Global reportb |
2024 |
150 000 |
|
|
|
|
|
|
|
|
|
| both sexes all ages Global reportb |
7 800 000 |
|
|
|
|
|
|
|
|
|
| female 15 years and older Global reportb |
5 100 000 |
|
|
|
|
|
|
|
|
|
| male 15 years and older Global reportb |
2 600 000 |
|
|
|
|
|
|
|
|
|
| both sexes all ages THEMBISA 5.0c |
2025 |
7 860 300 |
893 156 |
425 503 |
2 033 850 |
1 965 490 |
679 683 |
753 339 |
103 917 |
510 450 |
491 665 |
Percentage of people living with HIV (PLHIV) who know their status (1st 95)
DHISa |
2025 Q1 |
94.5 |
92.7 |
94.1 |
94.7 |
96.3 |
91.5 |
95.4 |
93.1 |
94.6 |
94 |
Child ART Total
DHISa |
2025 Q1 |
281 201 |
38 388 |
15 929 |
45 568 |
76 086 |
30 457 |
28 939 |
6 253 |
19 565 |
20 016 |
Total clients remaining on ART at the end of the month
DHISa |
March 2025 |
5 614 691 |
627 519 |
324 851 |
1 261 264 |
1 569 199 |
466 348 |
582 012 |
73 870 |
377 081 |
332 547 |
Clients remaining on ART rate
all ages DHISa |
2025 Q1 |
69.7 |
69.3 |
73.5 |
64.7 |
77.1 |
62.9 |
74.8 |
67.6 |
67.8 |
61.4 |
Number of patients receiving ART
both sexes all 15 years and older Global reportb |
2024 |
6 310 662 |
|
|
|
|
|
|
|
|
|
| both sexes 0-14 years Global reportb |
|
97 947 |
|
|
|
|
|
|
|
|
|
| both sexes all ages Global reportb |
|
6 212 715 |
|
|
|
|
|
|
|
|
|
| both sexes all ages THEMBISA 5.0c |
2024 |
6 177 250 |
678 426 |
344 720 |
1 503 480 |
1 682 410 |
487 749 |
631 679 |
78 850 |
418 202 |
379 782 |
Antiretroviral coverage (2nd 95)
DHISa |
2025 Q1 |
73.7 |
74.7 |
78.1 |
68.3 |
80.1 |
68.8 |
78.5 |
72.7 |
71.6 |
65.4 |
Child with viral load suppressed rate 12 months
0–14 years DHISa |
2025 Q1 |
73.5 |
77.3 |
81 |
73.4 |
76 |
82.6 |
65 |
60 |
58.3 |
68 |
Adult with viral load suppressed rate 12 months
15+ years DHISa |
2025 Q1 |
92.4 |
91.4 |
94 |
92.2 |
93.1 |
92.8 |
91.8 |
91.9 |
91.2 |
93 |
ART client viral load suppressed rate (VLS)
DHISa |
2025 Q1 |
92.2 |
91.1 |
93.9 |
92.1 |
92.9 |
92.4 |
91.3 |
91.2 |
90.6 |
93.1 |
HIV viral load suppression (3rd 95)
DHISa |
2025 Q1 |
92.0 |
91 |
94 |
92 |
93 |
92 |
91 |
91 |
91 |
93 |
Antiretroviral coverage (2nd 95)
both sexes 0-14 years THEMBISA 5.0c |
2025 |
65.6 |
69.7 |
58.7 |
53.4 |
64.8 |
57.8 |
68.8 |
74.1 |
64.6 |
80.4 |
| both sexes 15-24 years THEMBISA 5.0c |
56.4 |
46.8 |
60.1 |
51.3 |
66 |
46.7 |
63.6 |
52.4 |
59.1 |
51.3 |
| both sexes all ages THEMBISA 5.0c |
78.6 |
76 |
81.6 |
73.9 |
85.6 |
71.8 |
83.9 |
75.9 |
82 |
77.3 |
| both sexes med schemesd |
2024 |
89.0 |
|
|
|
|
|
|
|
|
|
Antiretroviral effective coverage
DHISa |
2025 Q1 |
51.0 |
44.5 |
47.5 |
49 |
60.7 |
54.3 |
60.2 |
33.3 |
54.8 |
17 |
Infant PCR test positive around 10 weeks rate
DHISa |
2024/25 |
0.4 |
0.5 |
0.2 |
0.3 |
0.3 |
0.4 |
0.4 |
0.9 |
0.5 |
0.3 |
Antenatal client initiated on ART rate
DHISa |
2024/25 |
96.6 |
97.9 |
100.6 |
98.5 |
99 |
98.8 |
100.1 |
92.7 |
95.5 |
72.4 |
Medical male circumcision 10-14 years rate
DHISa |
2024/25 |
53.5 |
29.0 |
48.7 |
58.7 |
62.4 |
68.8 |
48.2 |
56.8 |
36.8 |
29.1 |
Medical male circumcision 15 years and
older rate
DHISa |
2024/25 |
46.5 |
71.0 |
51.3 |
41.3 |
37.6 |
31.2 |
51.8 |
43.2 |
63.2 |
70.9 |
Male circumcision performed by medical professional in the traditional sector
DHISa |
2024/25 |
124 643 |
12 351 |
890 |
4 310 |
20 116 |
3 982 |
71 827 |
105 |
10 993 |
69 |
Male circumcision (% of men who are circumcised)
15-49 years THEMBISA 5.0c |
2025 |
66.9 |
80.9 |
69.3 |
76.6 |
62.1 |
93.1 |
82.8 |
42.6 |
60.4 |
46.3 |
TB/HIV co-infected client on ART rate (ETR.Net)
DHISa |
2023 |
92.5 |
95.2 |
88.8 |
91.3 |
94.9 |
82.9 |
94.2 |
88.4 |
89.3 |
93.2 |
| DHISa |
2024 |
93.6 |
96.2 |
84.8 |
92.6 |
96.1 |
89.7 |
94.2 |
86.6 |
90.4 |
93.9 |
| DHISa |
2025 |
93.2 |
95.6 |
84.3 |
92.1 |
96.6 |
85.3 |
90.4 |
90 |
91.3 |
94.2 |
HIV viral load suppression (3rd 95)
both sexes all ages Global reportb |
2024 |
74.0 |
|
|
|
|
|
|
|
|
|
| both sexes 0-14 years Global reportb |
52.0 |
|
|
|
|
|
|
|
|
|
| female 15 years and older Global reportb |
78.0 |
|
|
|
|
|
|
|
|
|
| male 15 years and older Global reportb |
68.0 |
|
|
|
|
|
|
|
|
|
| both sexes 0-14 years THEMBISA 5.0 <400 copies/mlc |
2025 |
75.1 |
69.0 |
78.6 |
74.3 |
80.4 |
68.9 |
74.8 |
64.6 |
67.2 |
80.3 |
| both sexes all ages THEMBISA 5.0 <400 copies/mlc |
93.5 |
91.4 |
94.5 |
93.3 |
95.1 |
91.9 |
93.5 |
89.6 |
90.6 |
95.0 |
| female 15 years and older THEMBISA 5.0 <400 copies/mlc |
94.3 |
92.3 |
95.2 |
94 |
95.8 |
92.8 |
94.2 |
90.6 |
91.6 |
95.7 |
| male 15 years and older THEMBISA 5.0 <400 copes/mlc |
92.7 |
90.2 |
93.9 |
92.5 |
94.6 |
90.4 |
92.6 |
88.3 |
89.3 |
94.6 |
REFERENCE NOTES
a DHIS
b UNAIDS 2025
c THEMBISA v5.0
d CMS 2025
DEFINITIONS
Adult living with HIV [Number] — Estimated number of adults (15+ years) living with HIV.
Adult with viral load suppressed rate 12 months [Percentage] — Proportion of adult ART clients (15 years and older) with a suppressed viral load 12 months after starting treatment. This indicates the population-level immunological impact of clients on ART.
Antenatal client initiated on ART rate [Percentage] — Antenatal clients started on ART as a proportion of the total number of antenatal clients who are HIV positive and not previously on ART.
Antenatal client tested for HIV [Percentage] — Proportion of women coming for their first antenatal visit who are tested for HIV.
Antiretroviral coverage (2nd 95) [Percentage] — The number of patients receiving ART, divided by the number needing treatment. The denominator has changed over time, due to changes in treatment guidelines affecting the criteria for treatment eligibility. The latest definition is that all HIV-infected patients should be on ART. This indicator is also one of the 95-95-95 global targets for AIDS (UNAIDS).
Antiretroviral effective coverage [Percentage] — Proportion of HIV-positive people on ART and virally suppressed. Any implausible values (>100) capped at 100, zero or missing values set to 1.
ART client viral load suppressed rate (VLS) [Percentage] — ART clients with a suppressed viral load as a proportion of ART clients with a viral load test done.
Child ART Total [Number] — The number of children (0–14 years) recorded as remaining on antiretroviral treatment at the end of the reporting month.
Child living with HIV [Number] — Estimated number of children (0-14 years) living with HIV.
Child with viral load suppressed rate 12 months [Percentage] — Proportion of child ART clients (0–14 years) with a suppressed viral load 12 months after starting treatment.
Clients remaining on ART rate [Percentage] — Percentage of estimated people living with HIV who remain on ART; the routine data equivalent of antiretroviral coverage.
HIV viral load suppression (3rd 95) [Percentage] — Percentage of people on ART who are virologically suppressed (VL level <= 1000 copies/mL). This indicator is also one of the 95-95-95 global targets for AIDS (UNAIDS).
Infant PCR test positive around 10 weeks rate [Percentage] — Infants testing PCR positive at the follow-up test as a proportion of infants PCR tested around 10 weeks.
Male circumcision (% of men who are circumcised) [Percentage] — The percentage of men (15-59 years, unless otherwise specified) who have been circumcised.
Medical male circumcision 10-14 years rate [Percentage] — Medical male circumcisions performed 10-14 years as a proportion of total medical male circumcisions performed.
Medical male circumcision 15 years and older rate [Percentage] — Medical male circumcisions performed in clients 15 years and older as a proportion of total medical male circumcisions performed.
Medical male circumcision performed by medical professional in the traditional sector [Number] — Male circumcision performed by medical professional in the traditional sector (10-14 years) / Male circumcision performed by medical professional in the traditional sector (15 years and older).
Number of patients receiving ART [Number] — Number of patients receiving ART.
People living with HIV (PLHIV) [Number] — The number of people who are HIV-positive.
Percentage of people living with HIV (PLHIV) who know their status (1st 95) [Percentage] — Percentage of people living with HIV who know their HIV status. This indicator is also one of the 95-95-95 global targets for AIDS (UNAIDS).
TB/HIV co-infected client on ART rate (ETR.Net) [Percentage] — Percentage of HIV-positive TB clients (all types of TB) recorded as being on ART.
Total clients remaining on ART at the end of the month [Number] — The total number of clients of all ages recorded as remaining on antiretroviral treatment at the end of the reporting month.
Total living with HIV [Number] — The estimated number of people who are HIV-positive.
Tuberculosis
Tuberculosis remains one of South Africa’s leading causes of death, but the trajectory of the epidemic is one of the country’s clearest public health successes. Tuberculosis incidence was estimated at 389 per 100 000 population in 2024, and the WHO’s Global TB Report records a reduction in incidence of roughly 60% between 2015 and 2024, among the steepest sustained declines observed in any high-burden country.47 An estimated 249 000 people developed TB in 2024, including about 14 000 with drug-resistant disease.47 This progress is closely linked to the expansion of the antiretroviral programme and intensified TB screening. South African modelling suggests that ART and expanded screening have accounted for substantial reductions in TB incidence, although other programme and epidemiological factors have also contributed.48 Two-thirds of incident TB cases (66%) occur in people living with HIV, and the incidence of HIV-associated TB, at 209 per 100 000, accounts for more than half the national total. The case detection rate, the share of estimated incident cases actually notified, has risen to 74%, meaning roughly a quarter of cases are still missed by the system each year (Table 5). Notifications from the private sector are incomplete, so the share of missed cases that reflects genuine non-diagnosis rather than diagnosis outside the reporting system cannot be established from these data.47
Mortality is where the story turns. While incidence has fallen steeply, TB deaths have proved far more stubborn. The reported TB mortality rate excluding HIV was 40 per 100 000 in 2024, with a further 46 per 100 000 among people living with HIV whose deaths were officially attributed to HIV/AIDS.47 Routine data recorded 13 991 deaths among drug-susceptible TB patients in the treatment cohort in 2024, concentrated in the high-burden provinces of the Eastern Cape (2 771), KwaZulu-Natal (2 879) and Gauteng (2 186).32 The contrast between declining incidence and persistently high mortality suggests that reductions in transmission and disease occurrence have not been matched by equivalent improvements across the diagnostic and treatment pathway. South African evidence identifies undiagnosed or late-diagnosed TB, failure to initiate treatment, HIV infection, drug resistance, co-morbidities, and health-system weaknesses as important contributors to TB mortality.49,50
Treatment outcomes show why mortality is proving hard to move. The drug-susceptible treatment success rate was 76.2% in 2023, short of the WHO’s 90% benchmark and little changed in recent years.51 Success falls sharply as drug resistance increases to 64.7% for multidrug-resistant (MDR) TB and 57.4% for extensively drug-resistant (XDR) TB nationally, with wide provincial variation at each level (Figure 11). The resistant categories are the most volatile where XDR-TB treatment success ranges from 42.9% in the Free State and 43.8% in Mpumalanga to 73.7% in the Northern Cape. The wide provincial range in XDR-TB treatment success should be interpreted cautiously because relatively small cohorts may produce unstable percentages, although differences in access to and organisation of specialised care may also contribute.51 Around 5 689 laboratory-confirmed cases of MDR-TB were reported in 2024 according to the Global TB Report.47 The pattern in which North West recorded the highest drug-susceptible success (87.5%) but middling resistant-TB outcomes, while Limpopo’s three categories converged near 70% suggest that performance is programme-specific rather than uniform across the TB response.
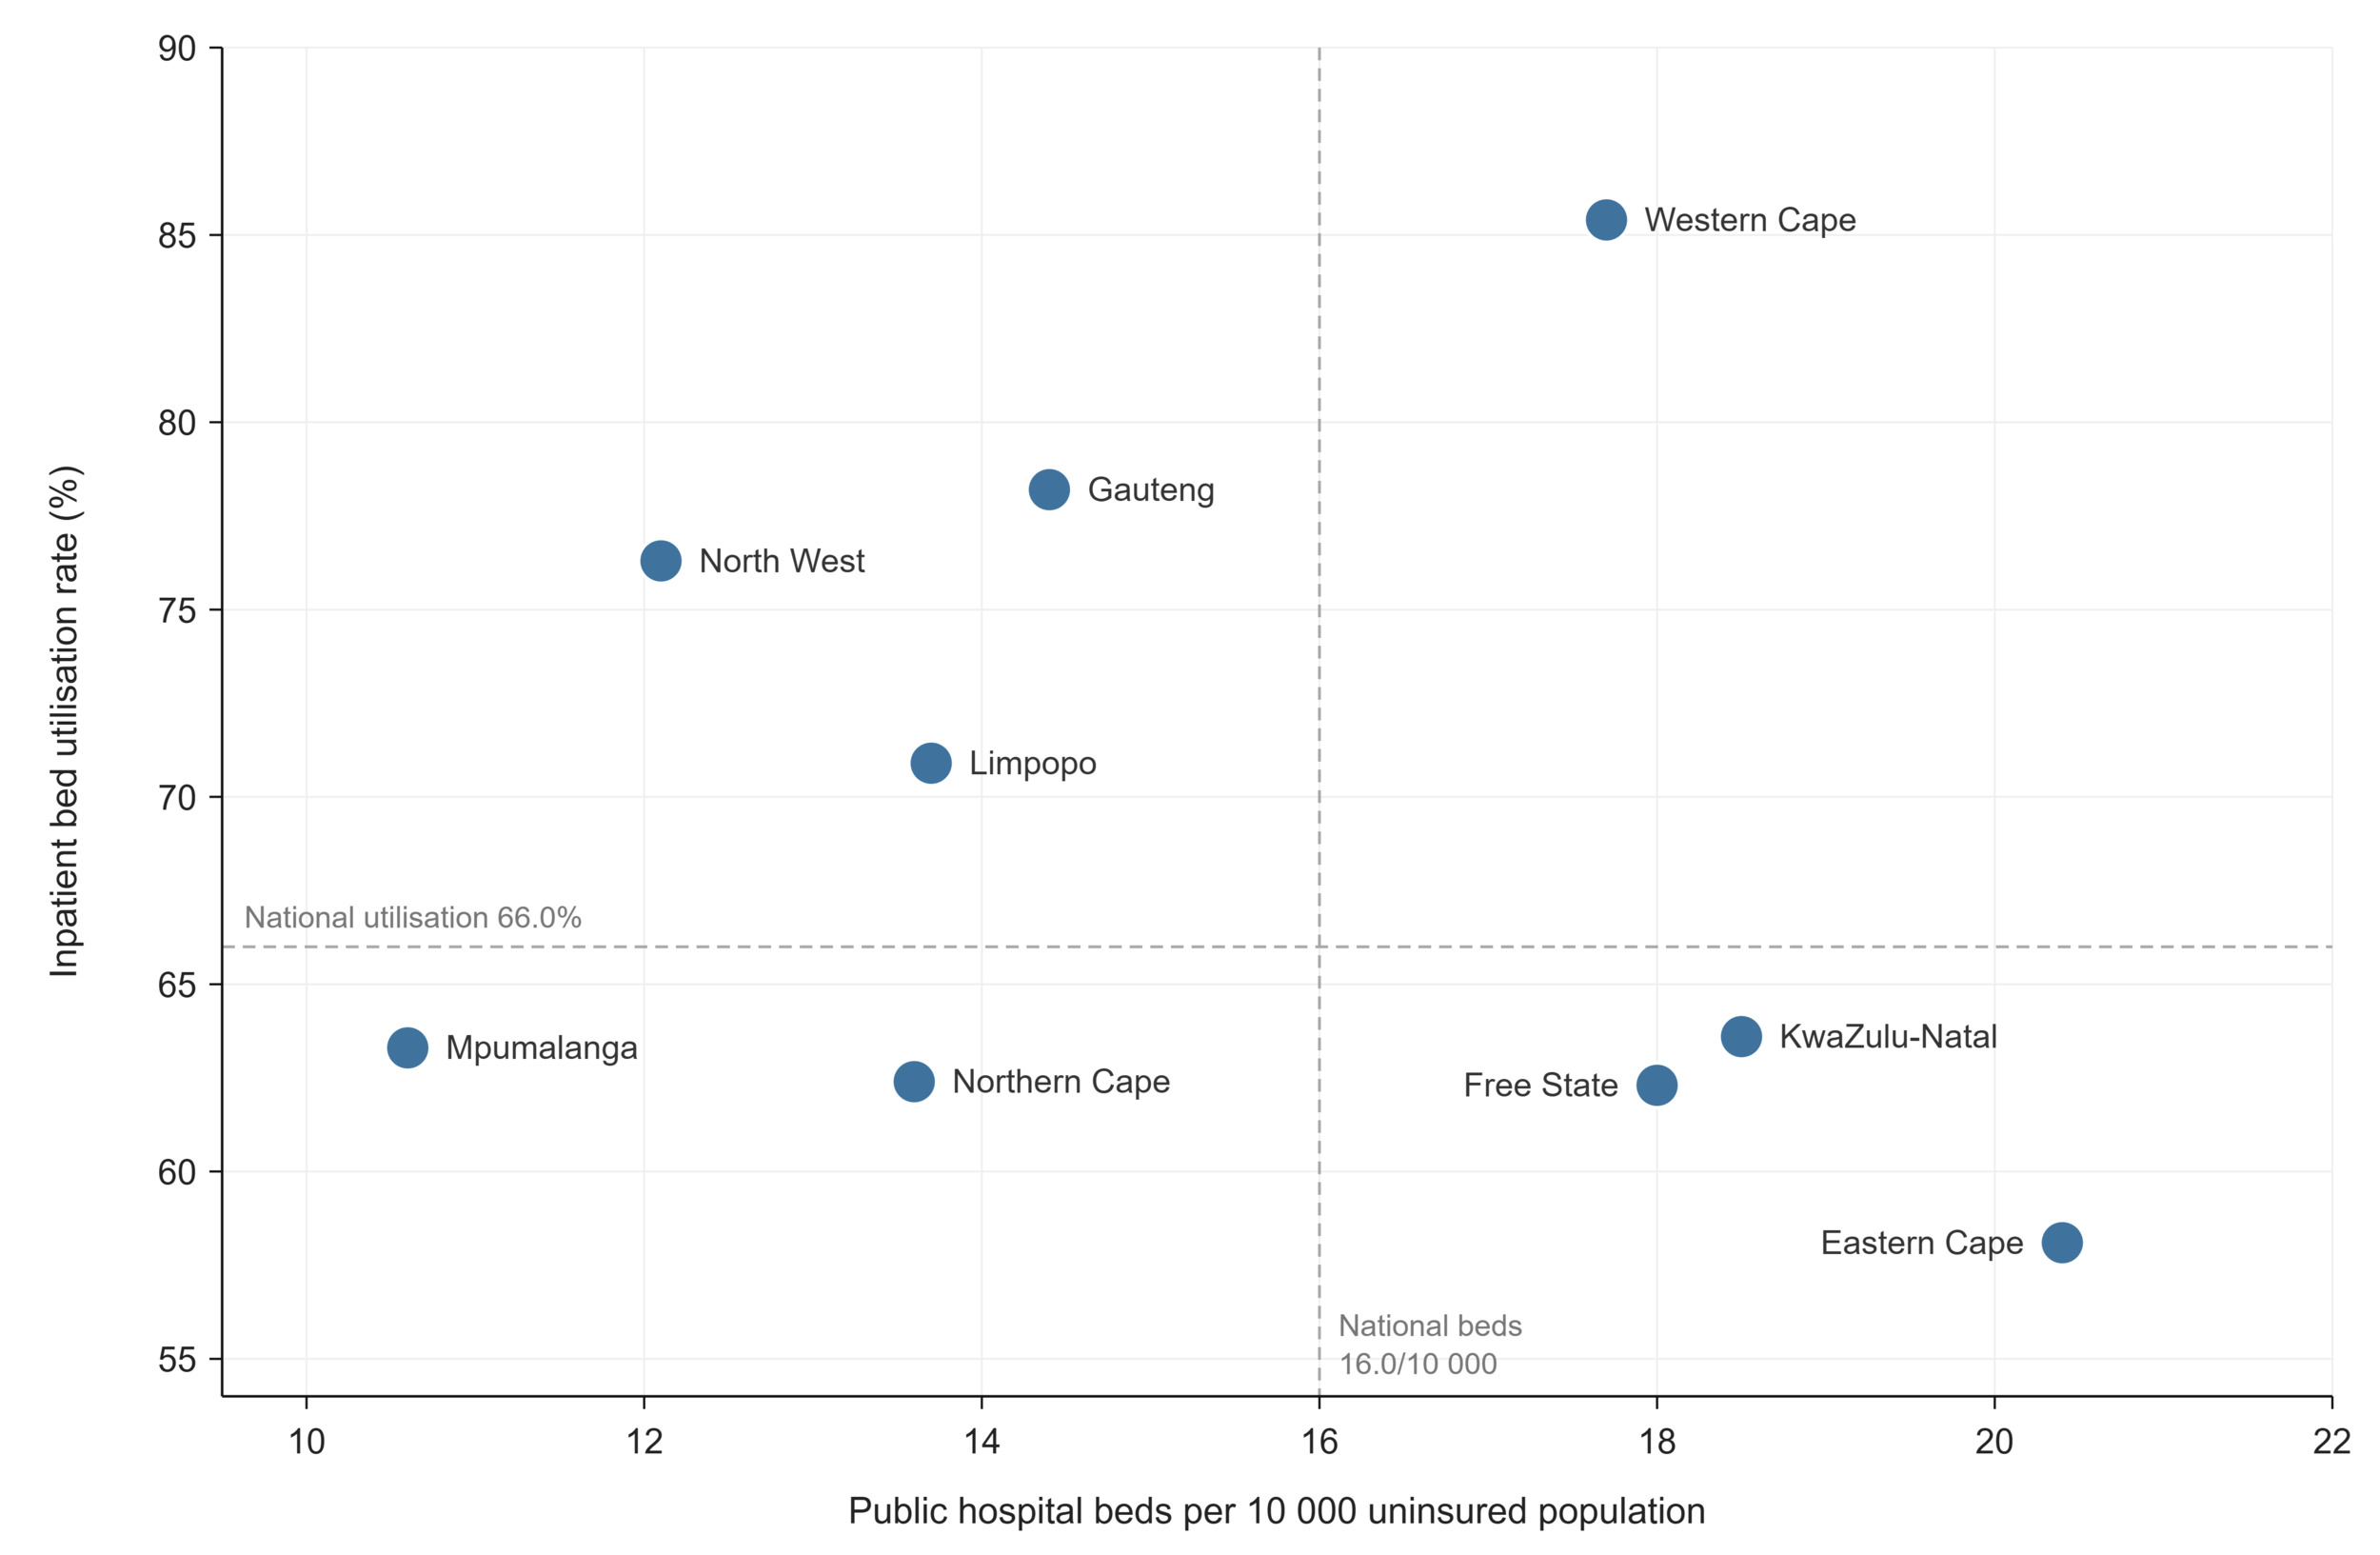
Figure 11.TB treatment success rate by drug-resistance category and province, 2023, against the WHO End TB 90% target
Case-finding effort has intensified markedly. Almost three million TB tests were conducted in 2024, and the national programme reached 98.2% of its testing target for the year.47 This reflects a deliberate strategic shift. South Africa’s 2018 national TB prevalence survey found that a majority of people with active TB did not report symptoms, revealing that the long-standing reliance on symptom-based screening was missing a large share of cases.52 In response, the National TB Programme adopted targeted universal testing, offering testing to high-risk groups such as people living with HIV and close contacts regardless of symptoms, and has since scaled this into the End TB Campaign, which aims to test five million people in 2025/26.53 The provincial testing figures, however, need careful reading: the share of the target tested exceeds 100% in several provinces and reaches 147.3% in KwaZulu-Natal and 131.7% in Gauteng, an artefact of targets set against modelled population denominators rather than a sign that case-finding is complete.
Learning signals: TB
What does the data reveal? The two halves of the TB response are moving at very different speeds. Incidence has fallen by around 60% since 2015, one of the steepest declines recorded anywhere, yet mortality has barely shifted, and treatment success sits well short of the 90% target across every province and every drug-resistance category. Success also falls as resistance rises, from 76% for drug-susceptible TB to 65% for MDR-TB and 57% for XDR-TB, with the resistant categories varying so widely between provinces that outcome depends heavily on where a patient is treated. The tight coupling of TB and HIV, with two-thirds of incident TB cases occurring in PLHIV, means neither epidemic can be read on its own.
Is the system responding? TB is arguably the clearest learning cycle in this paper. The 2018 national prevalence survey found that most people with TB reported no symptoms, which exposed the limits of symptom-based screening and led directly to the adoption of targeted universal testing and, in turn, the End TB Campaign's goal of testing five million people in 2025/26. A survey identified a blind spot, and testing policy changed in response. Drug-resistant TB treatment has been similarly responsive, with shorter all-oral regimens replacing older injectable-based ones as the evidence accumulated. The surveillance apparatus itself, spanning EDRWeb, the laboratory system and DHIS, is among the most developed of any disease area, which is why TB can be described at a level of resolution that most conditions in this paper cannot.
What prevents learning? The system's ability to learn about TB mortality lags far behind its ability to count TB cases, and the gap is documented rather than hidden. TB death rates derived from cause-of-death data are not corrected for under-reporting or ill-defined coding, and that many deaths in HIV-positive TB patients are attributed to HIV rather than TB under international coding rules.10 Mortality is therefore the softest number in an otherwise strong evidence base, which matters because it is precisely the indicator refusing to improve. Case detection carries its own measurement tension: the share of the testing target reached exceeds 100% in several provinces, reaching 147% in KZ, which reflects testing targets set against modelled denominators rather than any real completeness of case-finding, and complicates comparison between provinces. As with the rest of this paper, these are not reasons to distrust the data but reasons to read it knowingly, and the knowing is not yet built into routine reporting. |
Table 5.Tuberculosis indicators
| Indicator |
Period |
SA |
EC |
FS |
GP |
KZ |
LP |
MP |
NC |
NW |
WC |
Case detection rate (all forms)
both sexes Global TBa |
2024 |
74 |
|
|
|
|
|
|
|
|
|
All DS TB patients in cohort
DHISb |
2023 |
221 822 |
46 144 |
9 833 |
32 833 |
45 185 |
11 879 |
10 891 |
7 399 |
12 009 |
45 649 |
Number of TB tests conducted
EDRWebc |
2024 |
2 991 134 |
458 852 |
92 971 |
578 006 |
908 393 |
117 749 |
207 987 |
85 079 |
141 396 |
400 701 |
Percentage of target tested for TB
EDRWebc |
2024 |
98.2 |
68.9 |
60.9 |
131.7 |
147.3 |
99.8 |
130.6 |
68.3 |
79.6 |
67.7 |
TB DS treatment success rate
EDRWebc |
2023 |
76.2 |
76.6 |
74.0 |
75.2 |
76 |
69.8 |
77.1 |
77.7 |
87.5 |
75.4 |
TB MDR treatment success rate
EDRWebc |
2023 |
64.7 |
65.9 |
63.4 |
66.1 |
70 |
72.1 |
66.6 |
67.6 |
74 |
53.2 |
TB XDR treatment success rate
EDRWebc |
2023 |
57.4 |
63.7 |
42.9 |
55.9 |
62.5 |
72.2 |
43.8 |
73.7 |
69.2 |
44.2 |
HIV prevalence in TB incident cases
both sexes Global TBa |
2024 |
66 |
|
|
|
|
|
|
|
|
|
Incidence of TB (all types) (per 100 000)
both sexes all ages Global TBa |
2024 |
389 |
|
|
|
|
|
|
|
|
|
| both sexes all ages Global TB PLHIVa |
209 |
|
|
|
|
|
|
|
|
|
Reported cases of MDR-TB
WHOa |
2024 |
5 689 |
|
|
|
|
|
|
|
|
|
Tuberculosis death rate per 100 000
(in HIV-positive people)
both sexes Global TBa |
2024 |
46 |
|
|
|
|
|
|
|
|
|
Tuberculosis mortality rate per 100 000 (excluding HIV)
both sexes Global TBa |
2024 |
40 |
|
|
|
|
|
|
|
|
|
DS TB patients who died
DHISb |
2024 |
13 991 |
2 771 |
896 |
2 186 |
2 879 |
1 031 |
951 |
595 |
725 |
1 957 |
REFERENCE NOTES
a Global TB 2025
b DHIS
c EDRWeb
DEFINITIONS
All DS TB patients in cohort [Number] — The number of drug-sensitive TB patients registered in the treatment cohort for the reporting period.
Case detection rate (all forms) [Percentage] — Proportion of incident cases of TB (all types) that were notified. For a given country, it is calculated as the number of notified cases of TB in one year divided by the number of estimated incident cases of TB in the same year, and expressed as a percentage.
DS TB patients who died [Number] — The number of drug-sensitive TB patients in the treatment cohort who died from any cause during treatment.
HIV prevalence in TB incident cases [Percentage] — Percentage of new TB cases that are HIV-positive.
Incidence of TB (all types) (per 100 000) [per 100 000 population] — Estimated number of cases of tuberculosis (all types) per 100 000 population (for the year). Adjusted for estimated under-reporting of TB cases and other factors.
Number of TB tests conducted [Number] — The volume of TB diagnostic tests performed within a defined period. It provides insight into TB testing coverage, service utilisation and case detection.
Percentage of target tested for TB [Percentage] — TB symptomatic clients 5 years and older tested for TB as a proportion of the testing target set for the period.
Reported cases of MDR-TB [Number] — Number of laboratory-diagnosed cases of MDR-TB. MDR-TB is defined as resistance to rifampicin and isoniazid, with or without resistance to other first-line anti-TB drugs.
TB DS treatment success rate [Percentage] — The percentage of drug-sensitive TB clients registered in EDRWeb who were cured plus those who completed treatment.
TB MDR treatment success rate [Percentage] — The percentage of TB clients (MDR TB) cured plus those who completed treatment.
TB XDR treatment success rate [Percentage] — TB XDR clients successfully complete treatment as a proportion of TB XDR clients started on treatment
Tuberculosis death rate per 100 000 (in HIV-positive people) [per 100 000 population] — Number of deaths due to TB in HIV-positive people per 100 000 population. Note that under International Classification of Diseases coding rules, deaths in HIV-positive people are assigned to HIV/AIDS as the underlying cause, so these deaths are counted separately from the tuberculosis mortality rate below.
Tuberculosis mortality rate per 100 000 [per 100 000 population] — Number of deaths due to tuberculosis (all types) reported per 100 000 population (for the year). Note that the estimates calculated from the Stats SA cause of death data are not corrected for under-reporting or ill-defined coding, and are thus not an accurate measure of mortality due to TB. In addition, deaths in HIV-positive TB cases are in practice often coded to TB rather than to HIV, contrary to the ICD-10 rule noted above.
Maternal and reproductive health
South Africa’s public health facilities recorded 815 329 deliveries, and 812 908 facility live births in 2024/25. Against this volume, 902 maternal deaths occurred in facilities in 2024/25, yielding an institutional maternal mortality ratio (iMMR) of 100.6 per 100 000 live births.32 The WHO’s population-level estimate places South Africa’s maternal mortality ratio at 118 per 100 000 live births for 2023.54 The two figures are not directly comparable, however, because the iMMR counts maternal deaths occurring in health facilities against facility live births, whereas the WHO population-level estimate aims to capture maternal deaths nationally and incorporates adjustments for underreporting and misclassification.55 The neonatal mortality rate stands at 12.4 deaths per 1 000 live births, and the facility stillbirth rate at 20.4 per 1 000 total births (Table 6).32
Provincially, the iMMR appears to span a threefold range, from 48.3 in the Western Cape to 136.2 in the Eastern Cape. This range demands a measurement-literate reading: the confidential enquiries system has long documented that provinces with stronger health information systems report institutional deaths more completely and therefore record higher and more accurate ratios than provinces that report poorly.56 Some of the apparent provincial gap could therefore be potentially a difference in visibility rather than mortality alone. The facility delivery rate offers an even starker measurement lesson, live in this year’s data: the national rate fell from 78.4% in 2023/24 to 63.4% in 2024/25, yet recorded deliveries declined by less than 6% over the same period.32 A fall of that size can only have come from the denominator, and its cause is documented: the population-based estimate of expected deliveries was recalculated using the updated Stats SA mid-year population estimates and the arithmetic shows the denominator rose by roughly 16% nationally and by around a third in the Eastern Cape and Limpopo. This is the series break anticipated in the demographic section arriving in practice, not a change in where women give birth. Limpopo, the apparent leader in 2023/24 (90.3%), now records 65.7%, while the Eastern Cape’s 48.8% is implausible as a literal measure of home birth prevalence. The rate is best read as an index that is highly sensitive to its underlying population series, not as coverage in the plain sense; and because the numerator excludes private sector deliveries, even the highest provincial values such as the Western Cape’s 72.4% and Gauteng’s 70.8%, understate facility-based childbirth.
Adolescent reproductive health
Adolescent reproductive health remains a defining challenge with consequences extending beyond pregnancy outcomes to education, economic opportunity, and future wellbeing.57,58 Facilities recorded 114 808 deliveries to mothers aged 15–19 in 2024/25, and deliveries to mothers aged 10–19 constituted 14.1% of all facility deliveries, ranging from 9.9% in Gauteng to 18.0% in the Eastern Cape (Figure 12).32 Birth registration data corroborates the scale, with 120 785 births registered to mothers aged 15–19 in 2024.10 A small subset of facility deliveries (n = 2 837) in 2024/25 occurred among girls aged 10–14 years, and these warrant separate and careful interpretation rather than presentation as a routine demographic statistic. Under South African law, children under 12 years are incapable of consenting to a sexual act, while sexual penetration involving children aged 12-15 years is generally criminalised, subject to limited close-in-age exceptions, under which consensual acts between adolescents of similar age are not criminalised. Pregnancies and deliveries in this age group should therefore prompt careful assessment for sexual abuse, coercion, or exploitation and, where a sexual offence is known, reasonably believed or suspected, appropriate mandatory reporting, child-protection, safeguarding and psychosocial-support responses.59,60
Meanwhile 140 737 terminations of pregnancy were performed in 2024/25, with striking provincial variation relative to births. The Western Cape and Gauteng recorded proportionally the most terminations, and Limpopo and the Northern Cape the fewest. The aggregate data cannot distinguish differences in underlying demand from differences in access, provider availability, referral pathways or reporting completeness. However, South African research has documented substantial service-access constraints, including shortages of willing and trained providers and weak organisational support for termination-of-pregnancy services.61 Modelled estimates of condom use at last sex among young women aged 15–24 average 26.6% nationally but fall as low as 15.1% in the Eastern Cape, which is the same province where adolescent deliveries are most concentrated.9
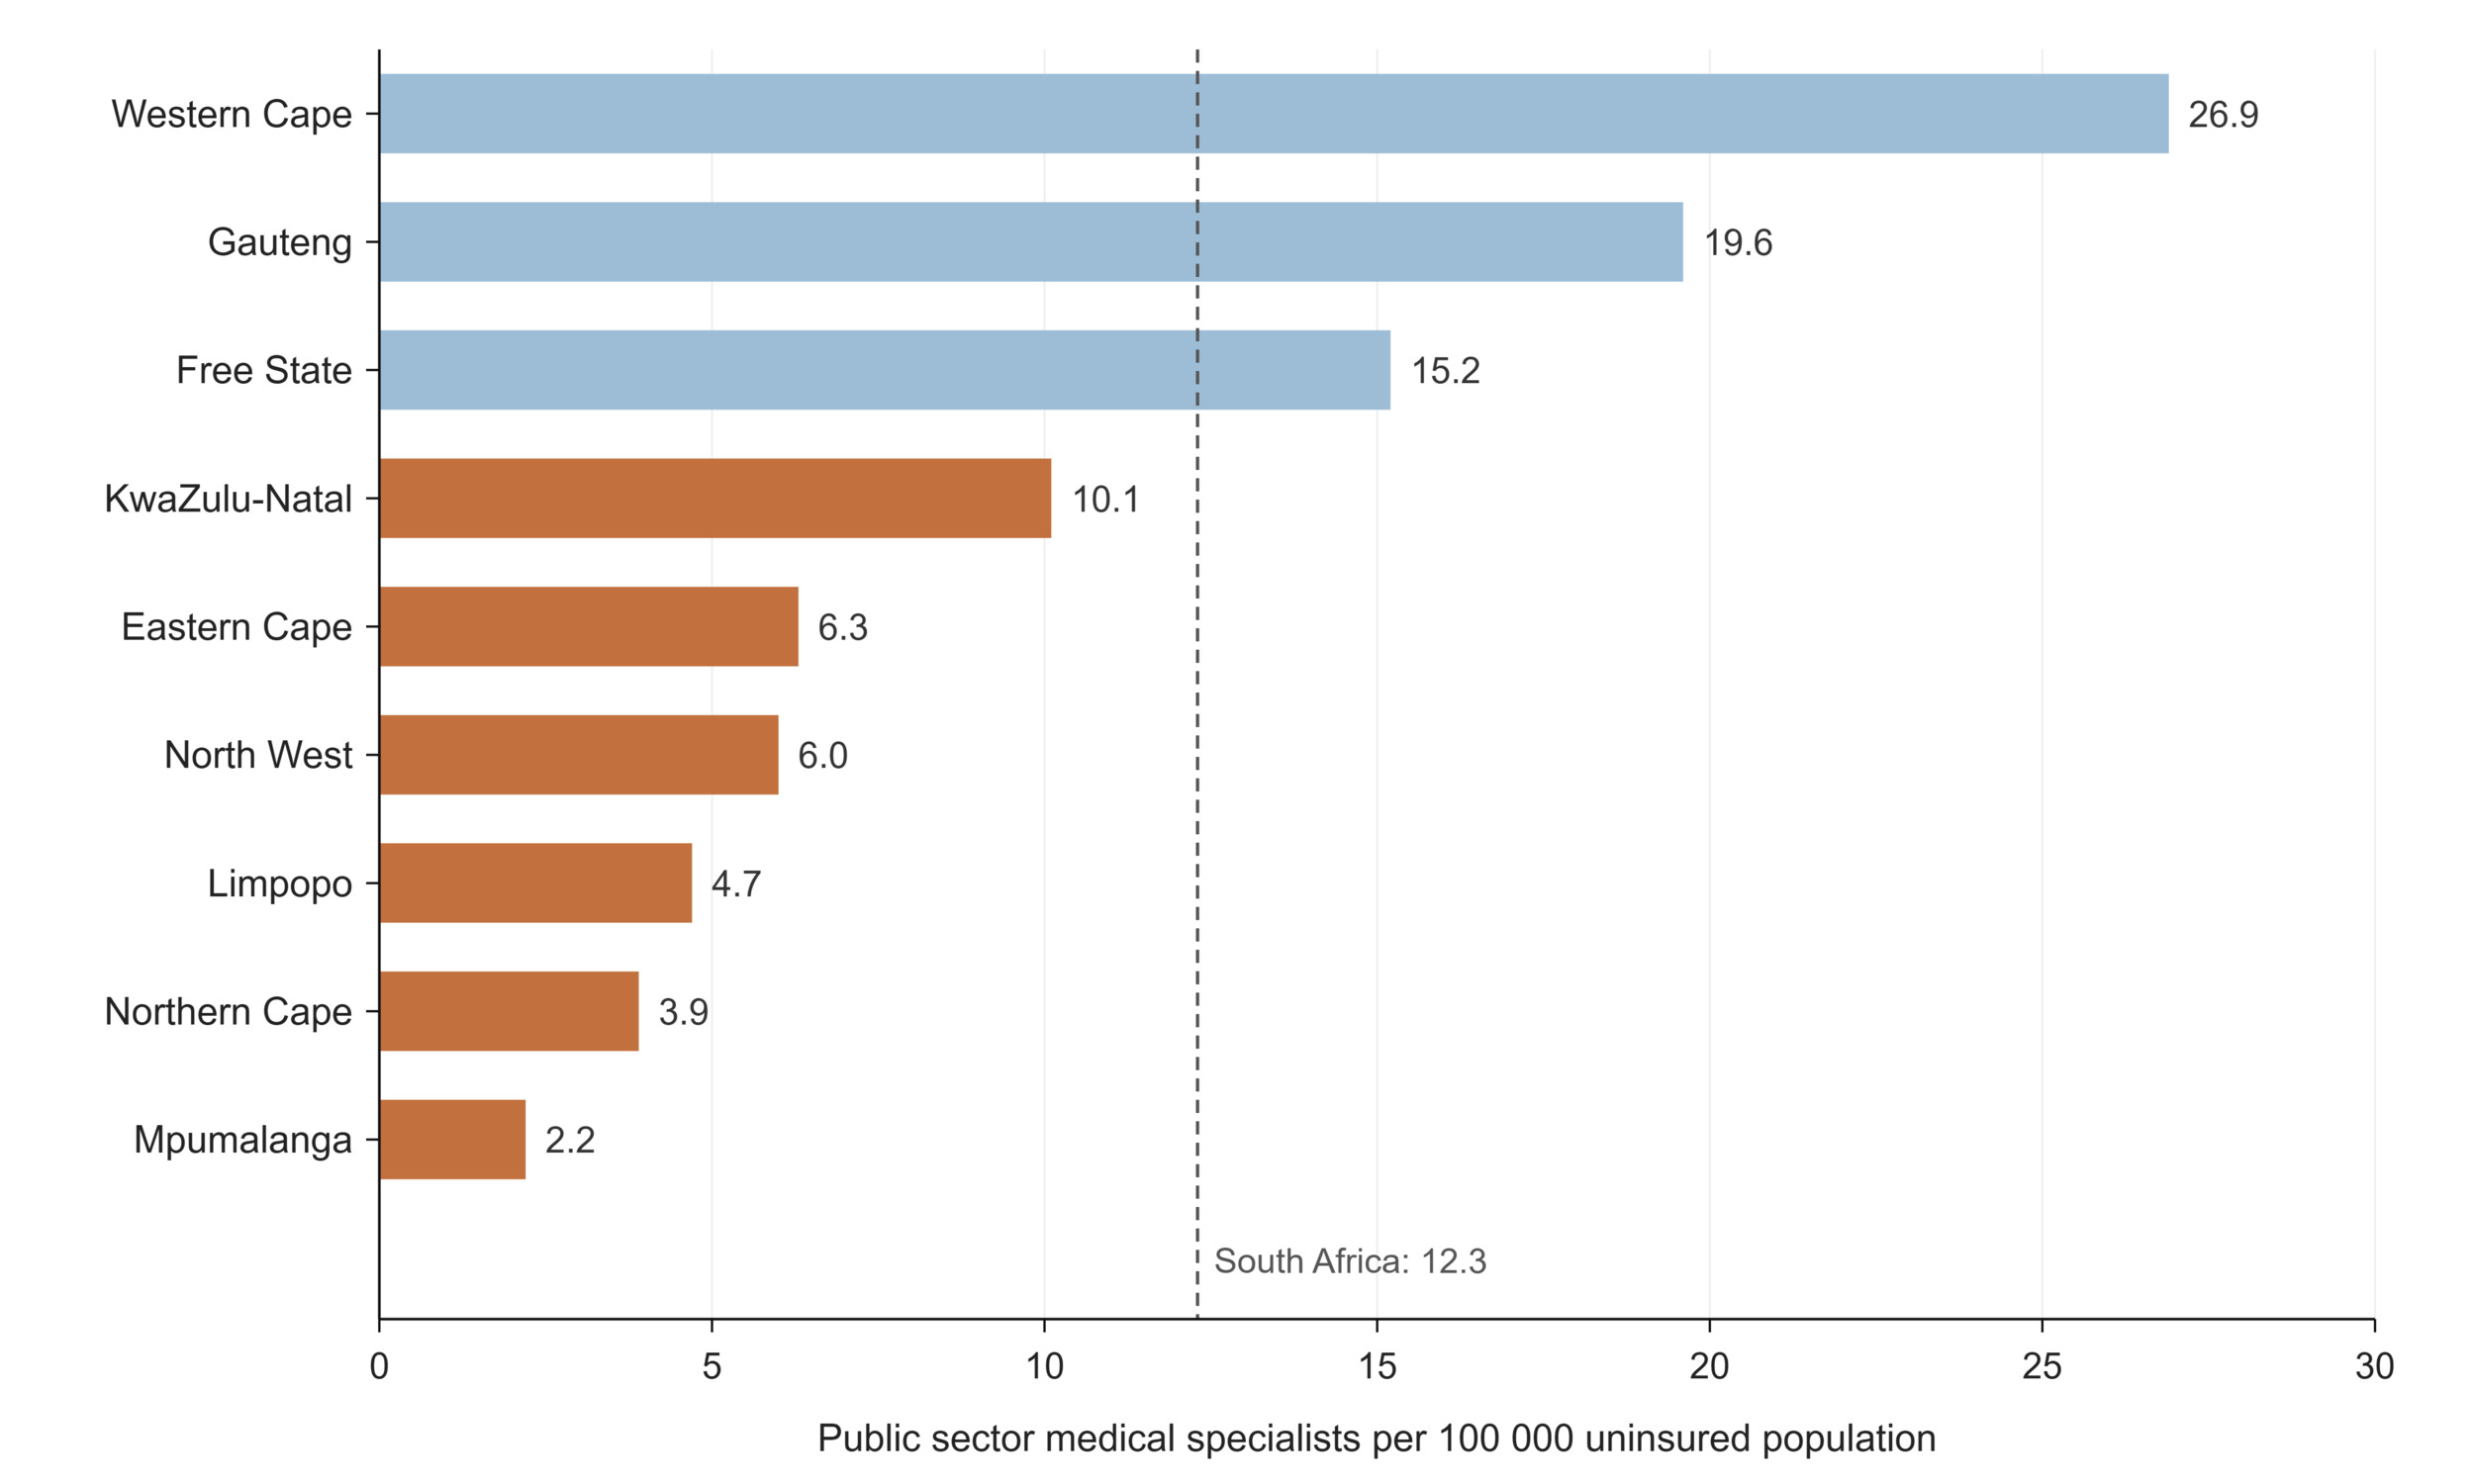
Figure 12.Deliveries to mothers aged 10–19 as a percentage of all facility deliveries by province, 2024/25
Indicators of intrapartum care raise questions of a different kind. One in three facility deliveries nationally (33.6%) is now by caesarean section, reaching 40.1% in KwaZulu-Natal against 25.3% in Mpumalanga which is far above the 10–15% population-level range beyond which WHO finds no evidence of additional mortality benefit.62,63 The private sector operates in a different register entirely: medical schemes recorded 590.5 caesarean sections per 1 000 birth admissions in 2024 which is nearly six in ten insured births and the rate is declining, down 6% on 2023 and by more than 10% in restricted schemes.13 Converting the schemes’ rates using CMS beneficiary counts allows the two sectors to be read together for the first time in this paper: the private sector delivered roughly 120 500 births in 2024, which is about one in eight of a combined national facility total of some 936 000, including approximately 71 100 caesareans, which lifts the combined national facility caesarean rate to about 37%.13 The private sector therefore performs substantially more caesarean sections than the public sector. Previous analysis of privately insured South African births found that caesarean rates remained high among younger women and women without the selected medical conditions identifiable in claims data, although the available data could not establish individual obstetric indications.64 Within the public sector, the provinces intervening most are not those with the best perinatal outcomes. The Free State combines an above-average caesarean rate (34.9%) with the country’s highest facility stillbirth rate (25.5 per 1 000 births), while the Western Cape achieves the lowest stillbirth rate (16.8 per 1 000 births) at a near-average caesarean rate. Given that the stillbirth rate is among the most sensitive available markers of obstetric care quality, the provincial pattern shows no simple relationship between caesarean-section rates and stillbirth outcomes. This suggests that intervention volume alone is insufficient to explain differences in outcomes; case mix, referral patterns, timeliness and quality of care, and reporting completeness may also contribute.65 The same conversion confirms where reproductive health burdens sit where insured adolescents accounted for roughly 2 700 births, which is under 3% of the national adolescent total, and schemes funded on the order of 2 000 terminations of pregnancy against the public sector’s 140 737, meaning the public system carries some 99% of documented terminations. Terminations performed in the private sector but not funded by a medical scheme, and those performed by non-governmental providers, are captured in neither source, so the public share of all terminations performed is likely to be overstated.13
Learning signals: maternal and reproductive health
What does the data reveal? Adolescent childbearing remains heavily concentrated in EC, NC, MP and KZ, where more than one in six facility deliveries is to a mother under 20 which is nearly double GP's share. Facility-based maternal mortality spans an apparent threefold range across provinces, but the more subtle signal is the decoupling of intervention from outcome: caesarean section rates well above clinical benchmarks coexist with stillbirth rates that vary little in the same direction, suggesting that higher intervention rates do not consistently correspond with better stillbirth outcomes.
Is the system responding? Maternal health offers the clearest evidence of a complete learning cycle. The National Committee on Confidential Enquiries into Maternal Deaths (NCCEMD) has, since 1998, systematically investigated institutional maternal deaths, ranked their causes, and translated the findings into practice, including nationally scaled emergency obstetric training informed directly by the enquiry's recommendations,56 with perinatal deaths audited through the parallel Perinatal Problem Identification Programme(PPIP).66 This is the practice-to-data-to-knowledge-to-practice loop operating as designed, and it long predates LHS vocabulary. The open question is sub-national: whether the provinces where adolescent deliveries concentrate are using that visibility to target prevention or merely recording it?
What prevents learning? Three measurement boundaries limit what this domain can teach. The first one being the facility-only lens where the DHIS and the confidential enquiries capture deaths in health facilities, and the gap between the institutional ratio (100.6) and the WHO's population estimate (118) reflecting differences in coverage and estimation methods. The second aspect is a documented reporting paradox where the NCCEMD itself cautions that provinces with stronger information systems report deaths more completely and therefore record higher institutional ratios. Although the caveat is published there is little evidence it travels with the numbers into provincial performance discussions. Lastly, denominators and units: the facility delivery rate's fifteen-point fall this year, produced by the recalculation of its denominator to the updated mid-year estimates, not by childbearing behaviour, shows how a series change can rewrite apparent performance overnight. And while private sector maternal data do exist, the two sectors' information systems measure the same events in mutually unconvertible units: the DHIS counts events against population denominators; medical schemes report rates per 1 000 beneficiaries. This paper could assemble a combined national picture only by manually joining the schemes' rates to their beneficiary tables; no routine publication does so. South Africa effectively runs two maternal health information systems that do not speak the same language, and the translation, though feasible, is left to the reader. Adolescent pregnancy, meanwhile, is measured by three non-comparable ways (household survey self-report, facility deliveries, and birth registration), which enables triangulation but invites accidental misquotation. |
Table 6.Maternal and reproductive health indicators
| Indicator |
Period |
SA |
EC |
FS |
GP |
KZ |
LP |
MP |
NC |
NW |
WC |
Condom use at last sex
female 15-24 years THEMBISA 5.0a |
2025 |
26.6 |
15.1 |
24.6 |
30.3 |
30.7 |
20.7 |
28 |
23.9 |
24.5 |
22.8 |
2025
female 25-49 years THEMBISA 5.0a |
25.7 |
22.5 |
26 |
25.5 |
32.8 |
21.6 |
29.3 |
22.1 |
25.9 |
18 |
Delivery 10-14 years in facility
female 10-14 years DHISb |
2024/25 |
2387 |
396 |
90 |
357 |
530 |
315 |
237 |
66 |
100 |
296 |
Delivery 15-19 years in facility
female 15-19 years DHISb |
2024/25 |
114 808 |
14 903 |
5 007 |
18 417 |
29 264 |
15 731 |
10 933 |
3 439 |
6 962 |
10 152 |
Delivery in 10 to 19 years in facility rate
female DHISb |
2024/25 |
14.1 |
18 |
13.3 |
9.9 |
16.6 |
15 |
16.6 |
17.2 |
14 |
11 |
Delivery by Caesarean section rate
female DHISb |
2024/25 |
33.6 |
35.2 |
34.9 |
35.2 |
40.1 |
27.4 |
25.3 |
25.7 |
28.7 |
33.5 |
Delivery in facility - sum
DHISb |
2024/25 |
815 329 |
81 862 |
37 163 |
191 534 |
175 404 |
103 574 |
66 974 |
19 531 |
49 038 |
90 249 |
Delivery in facility rate
female DHISb |
2024/25 |
63.4 |
48.8 |
59.6 |
70.8 |
62.7 |
65.7 |
63.5 |
65.1 |
55.6 |
72.4 |
Live birth in facility
both sexes DHISb |
2024/25 |
812 908 |
81 033 |
37 484 |
191 826 |
173 585 |
103 203 |
66 464 |
19 834 |
48 636 |
90 843 |
Maternal death in facility
female DHISb |
2024/25 |
902 |
122 |
66 |
248 |
161 |
113 |
79 |
20 |
42 |
51 |
Maternal mortality in facility ratio
female DHISb |
2024/25 |
100.6 |
136.2 |
104.8 |
107.3 |
89.2 |
104.7 |
109.4 |
115.8 |
110.2 |
48.3 |
Maternal mortality ratio (MMR)
female WHOc |
2023 |
118 |
|
|
|
|
|
|
|
|
|
Neonatal mortality rate (NMR) (deaths <28 days old per 1 000 live births)
both sexes WHOc |
2024 |
12.4 |
|
|
|
|
|
|
|
|
|
Teenage pregnancy
female 14-19 years GHSd |
2025 |
3 |
|
|
|
|
|
|
|
|
|
| Vital registration 15-19 yearse |
2024 |
120 785 |
|
|
|
|
|
|
|
|
|
ToPs (Terminations of Pregnancy)
DHISb |
2024/25 |
140 737 |
14 791 |
6 871 |
38 442 |
25 646 |
13 060 |
9 636 |
2 157 |
9 205 |
20 926 |
Stillbirth in facility rate
DHISb |
2024/25 |
20.4 |
22.2 |
25.5 |
19.4 |
22 |
18.6 |
20.4 |
23.7 |
20.8 |
16.8 |
REFERENCE NOTES
a THEMBISA v5.0
b DHIS
c World Health Organization Statistics 2026
d Stats SA GHS 2025
e Recorded Live Births 2024
DEFINITIONS
Condom use at last sex [Percentage] — Percentage of those, who reported ever having had sex, who used a condom the last time they had sex. Note that the precise definition of this indicator varies between surveys.
Delivery 15-19 years in facility [Number] — Deliveries where the mother is 15–19 years old, taking place in a health facility under the supervision of trained medical or nursing staff.
Delivery by Caesarean section rate [Percentage] — Delivery by Caesarean section as proportion of total deliveries in health facilities.
Delivery in 10 to 19 years in facility rate [Percentage] — Deliveries to women under the age of 20 years as proportion of total deliveries in health facilities.
Delivery in facility rate [Percentage] — Deliveries in health facilities as proportion of expected deliveries in the population. Expected deliveries are estimated as population under 1 year multiplied by 1.025 to compensate for still births and infant mortality.
Delivery in facility - sum [Number] — Any delivery taking place in a health facility under the supervision of trained medical/nursing staff.
Live birth in facility [Number] — Live birth resulting from a delivery in a facility.
Live births registered to women aged 15–19 years [Number] — The number of live birth occurrences registered in the civil registration system where the mother was aged 15–19 years at the time of the birth.
Maternal death in facility [Number] — Maternal death is death occurring during pregnancy, childbirth and puerperium within 42 days of termination of pregnancy, irrespective of the duration and site of pregnancy and the cause of death (obstetric and non-obstetric).
Maternal mortality in facility ratio [per 100 000 live births] — Women who die as a result of childbearing, during pregnancy or within 42 days of delivery or termination of pregnancy, per 100 000 live births, and where the death occurs in a health facility.
Maternal mortality ratio (MMR) [per 100 000 live births] — The number of women who die as a result of childbearing, during pregnancy or within 42 days of delivery or termination of pregnancy in one year, per 100 000 live births during that year.
Neonatal mortality in facility rate [per 1 000 live births] — Inpatient deaths within the first 28 days of life per 1 000 estimated live births. Estimated live births in population is calculated by multiplying estimated population under 1 year by 1.03 to compensate for infant mortality.
Neonatal mortality rate (NMR) (deaths <28 days old per 1 000 live births) [per 1 000 live births] — Number of deaths within the first 28 days of life, in a year, per 1 000 live births during that year. Also called Neonatal Death Rate (NDR).
Stillbirth in facility rate [per 1 000 births] — Stillbirths in a facility per 1 000 total births in a facility.
Teenage pregnancy [Percentage] — Percentage of women aged 15–19 years who are mothers or who have ever been pregnant. Note that surveys differ in whether the denominator is all women in the age group or only those who have ever had sex, so estimates are not always directly comparable.
ToPs (Terminations of Pregnancy) [Number] — The number of terminations of pregnancy.
Child health
An estimated 41 435 South African children died before their fifth birthday in 2024.67 How that toll translates into a rate depends on the source as illustrated in Table 7: the Stats SA mid-year estimates place the under-five mortality rate at 26.1 per 1 000 live births,7 while WHO/UNICEF estimate 35.1,54 and the GBD 34.9,68 a spread of a third in level, though all series agree that mortality is falling. Infant mortality shows the same pattern at closer range (23.1 to 26.8 per 1 000), with neonatal deaths at 12.4 per 1 000 live births, mortality between ages one and four at 11.1, and mortality among children aged 5–14 at 5.4 per 1 000. Boys die at consistently higher rates than girls at every age (under-five: 37.6 versus 32.4 per 1 000).54,55,67
Immunisation is where the child health system’s performance, and its measurement problems, are most exposed. Administrative full immunisation coverage under one year calculated by dividing doses reported through DHIS by the estimated target population, stood at 75.1% in 2024/25, some 15 percentage points below the national target of 90%, ranging from 84.6% in Gauteng to 59.4% in the Free State.32 Notably, the provincial pattern departs from the socio-economic gradient that structures most of this paper: the Western Cape (72.5%) falls below the national average, while KwaZulu-Natal (82.9%) and Mpumalanga (79.5%) exceed it. The WHO/UNICEF estimates of national immunisation coverage, which draw on both administrative and survey data, paint a similar level of 74% for both BCG and DTP3, 81% for first-dose and 82% for second-dose measles.69 These estimates indicate substantial national vaccination coverage gaps, which may translate into population immunity gaps, and which together, with the wide provincial variation in routine coverage, leave South Africa vulnerable to recurrent outbreaks of vaccine-preventable diseases.70 Measles is particularly sensitive to coverage gaps because very high and sustained population immunity is required to prevent transmission.71 BCG is administered at birth, and with most deliveries occurring in facilities, recorded coverage of 74% is difficult to reconcile with observed practice, a signal that the denominator, not only the programme, is being measured. Several mechanisms beyond the denominator could also contribute such as birth doses missed before discharge, incomplete recording or transmission from maternity registers, and private sector births whose doses never enter the DHIS numerator. These explanations cannot be separated in the routine data, and genuine service delivery gaps cannot be excluded. Because administrative coverage is calculated by dividing reported doses by an estimated target population, for which the denominator configured in webDHIS is the population aged under one year, inaccurate population projections or incomplete dose reporting can materially alter the resulting rate.72
Fully immunised under-one year is also a coarse yardstick on its own. Indicators of vaccination timeliness, dropout between doses, zero-dose children and district-level variation would offer more actionable signals for programme learning and are only partially available in routine reporting.
The medical schemes’ data offer the mirror-image caution: schemes record just 1.16 BCG doses per 1 000 insured infants,13 however, the extremely low rate is unlikely to represent true vaccine uptake. It more plausibly reflects incomplete capture of vaccinations administered as part of a delivery admission or outside the medical scheme claims system. Without linkage to vaccination records, however, the precise mechanism cannot be confirmed. Public administrative data is distorted by its denominator while private claims data is potentially blind to events that produce no bill. Each system, in its own way, measures its instrument.
The condition in which children enter life differs sharply by sector. In public facilities, 14.2% of live births weighed under 2 500 g in 2024/25, ranging from 11.9% in Limpopo to 18.7% in the Northern Cape (Figure 13),32 whereas medical schemes recorded a low-birth-weight rate of 6.5% among insured births, less than half the public rate.11 Although the aggregate data cannot establish the causes of this difference, the pattern is consistent with the social, behavioural and maternal-health gradients known to influence birthweight.73
Methodologically, this comparison is less exposed to the population-denominator uncertainty affecting coverage indicators because both the numerator and denominator are facility-based. Nevertheless, differences in case mix, sector utilisation, reporting practices and indicator construction should be considered when interpreting the gap.
The neonatal mortality comparison shows the opposite. The schemes report 0.13 neonatal deaths per 1 000 live births, definitionally identical to the national indicator, yet implying only around 15 neonatal deaths among some 118 000 insured live births, an order of magnitude below the lowest rates recorded anywhere in the world.13 The implausibly low neonatal mortality rate indicates incomplete ascertainment in the claims data. One possible explanation is that deaths occurring before an infant is registered as a beneficiary are not captured as infant claims, but this cannot be confirmed without linkage to membership and vital-registration records. Tellingly, the same data implies roughly 22 non-live-birth outcomes per 1 000 birth admissions, closely comparable to the public facility stillbirth rate of 20.4, because stillbirths occur during an observed admission. What happens inside the claim is counted; what happens after discharge is not. One compositional caution applies to the provincial pattern: Gauteng and the Western Cape sit slightly above the national public rate not necessarily because their mothers fare worse. In provinces with large insured populations, differential use of public and private maternity services may alter the risk profile of births remaining in the public sector denominator.
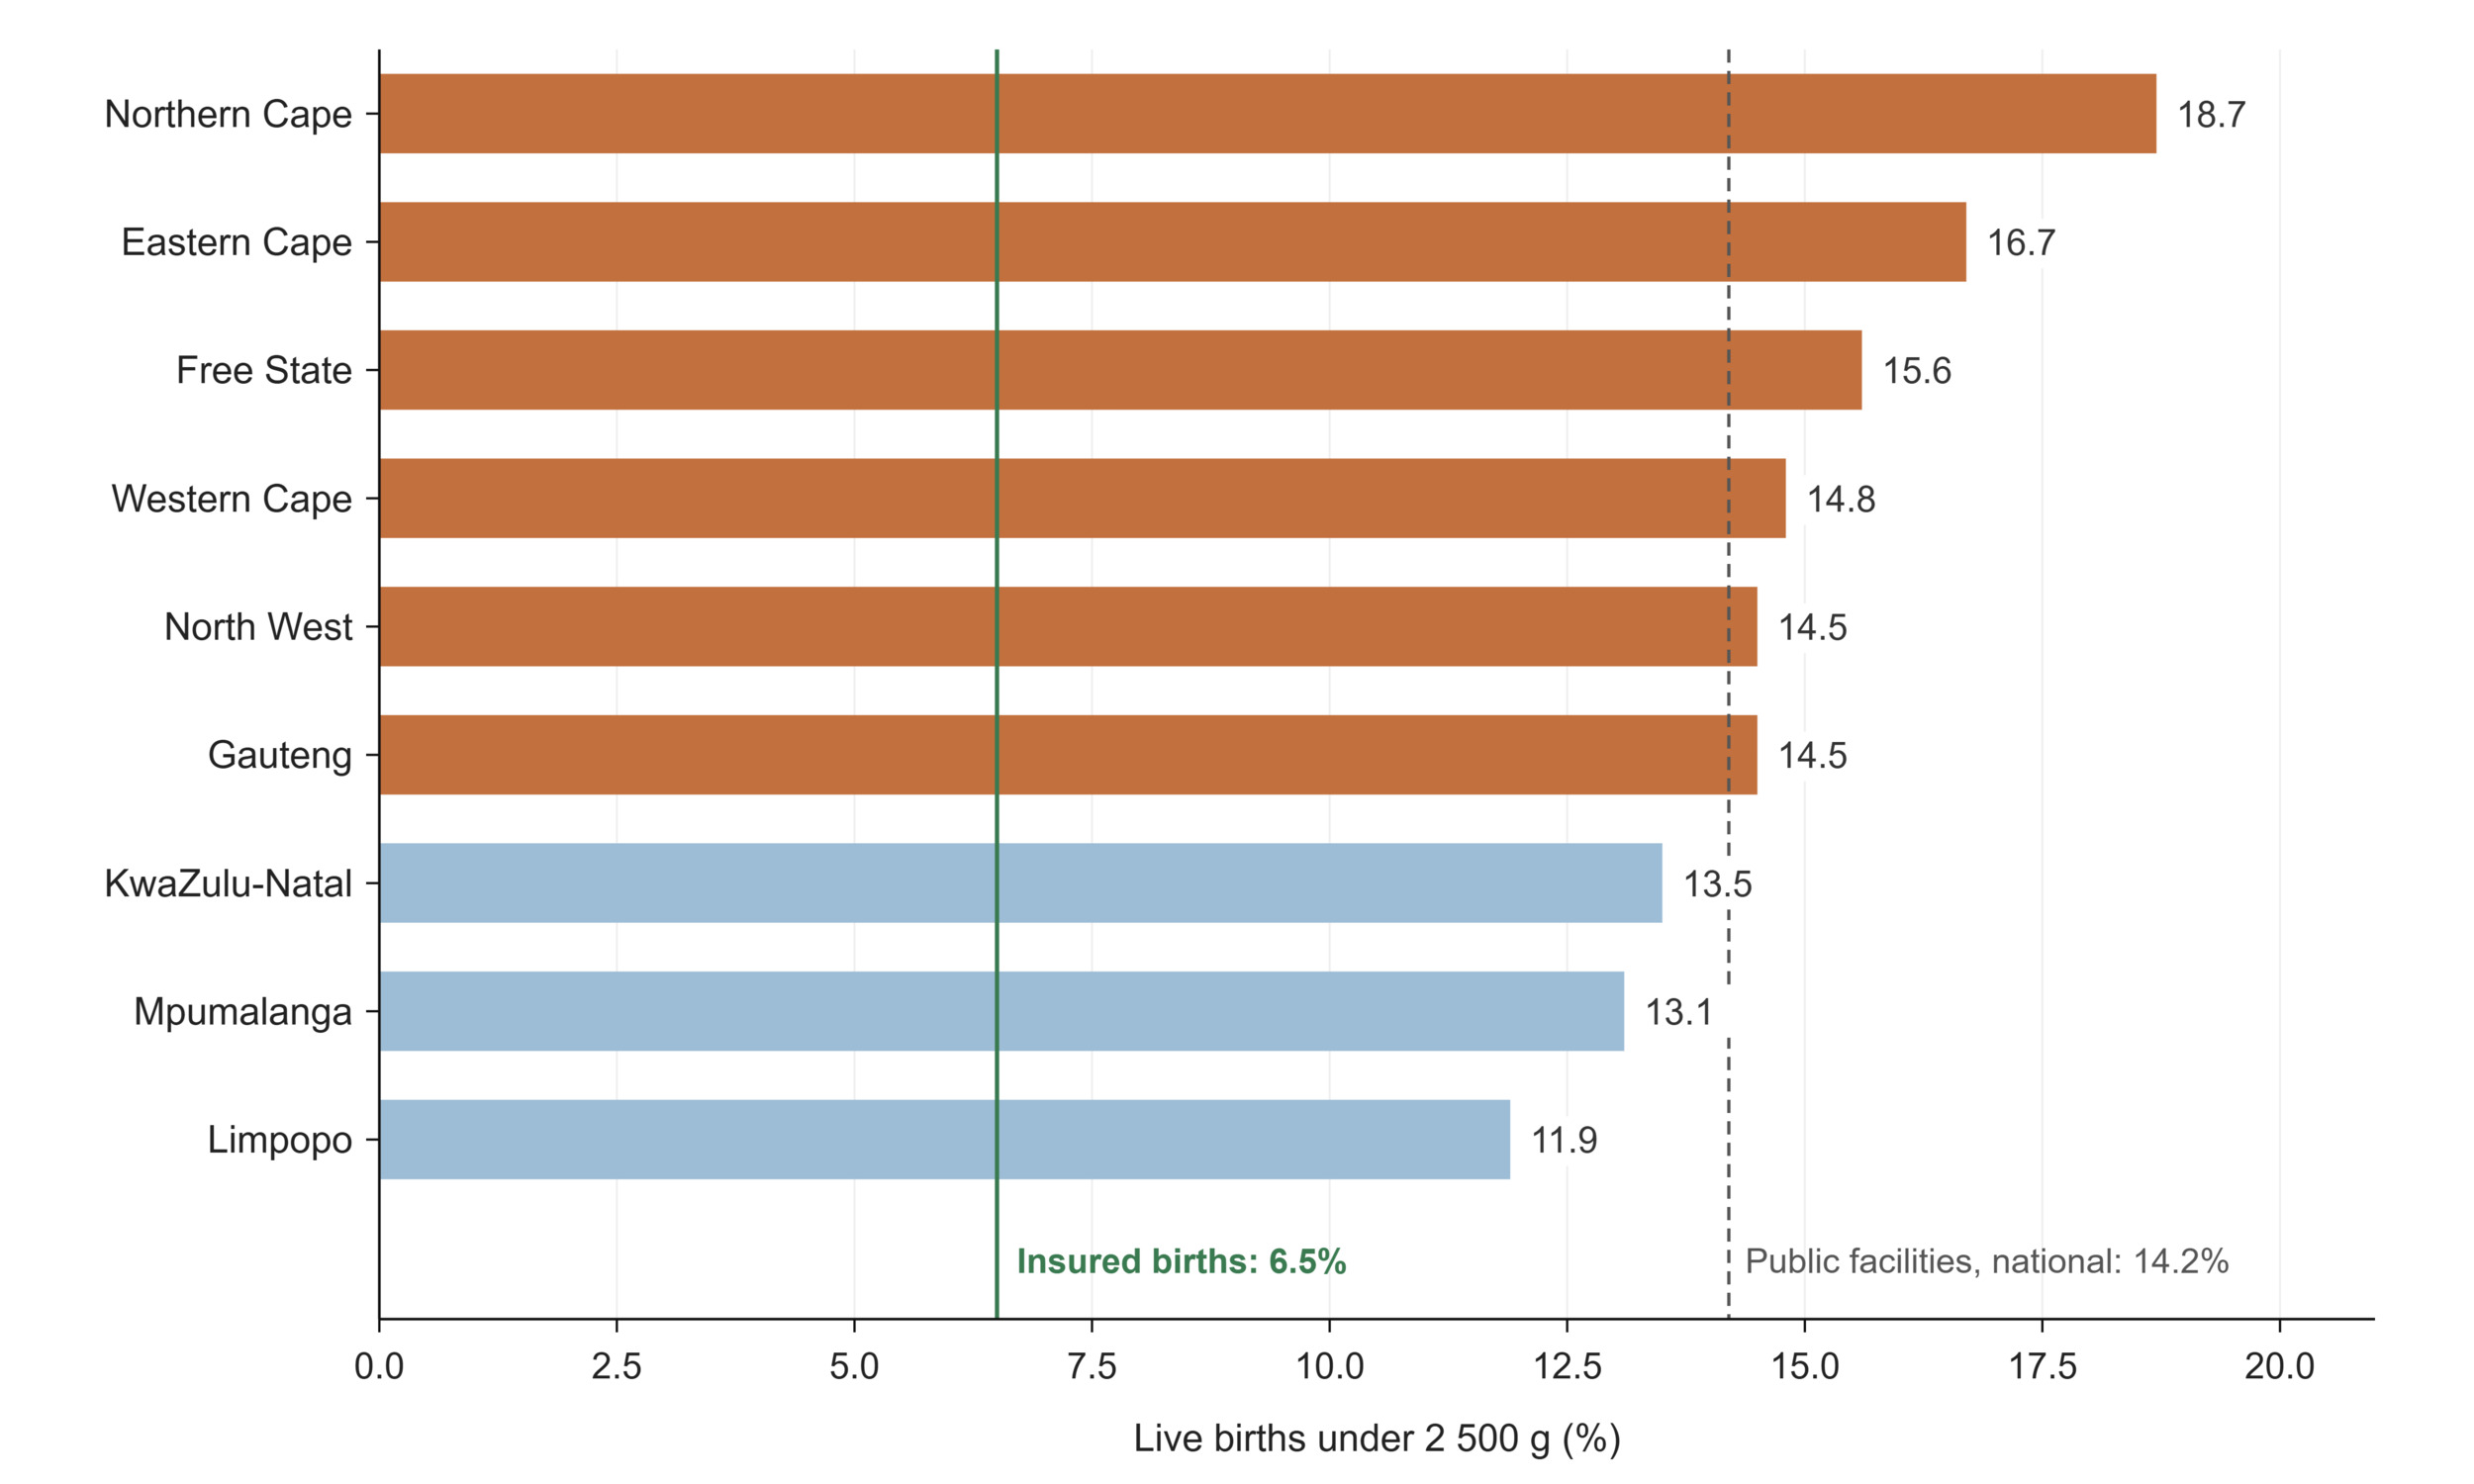
Figure 13.Percentage of live births under 2 500 g: public facilities by province (DHIS, 2024/25) against the medical schemes rate (CMS, 2024)
Source: DHIS and CMS, 2024.13
Beyond survival and service delivery, the GHS records the family circumstances in which children grow up: 11.2% of children under 18, roughly one in nine, have lost at least one biological parent, comprising 7.3% paternal orphans, 2.3% maternal orphans and 1.6% double orphans.8 Paternal orphanhood dominates everywhere and is highest in KwaZulu-Natal (8.9%) and the Eastern Cape (8.4%), the demographic residue of two decades of elevated adult male mortality from HIV, tuberculosis, and injury. Orphanhood remains a core marker of vulnerability, for school retention and mental health, and its concentration in the same provinces that carry the heaviest dependency ratios compounds the demographic pressures described earlier.74
Learning signals: child health
What does the data reveal? Child survival continues to improve, but the level of under-five mortality depends on the source consulted by up to a third, 26 or 35 deaths per 1 000 live births, even as all sources agree on the direction. Immunisation coverage is the domain's loudest warning: the national figure sits some fifteen points below the 90% target, with a twenty-five point spread between GP and FS, and the pattern breaks with the familiar geography, WC falls below the national average while KZ and MP exceed it, showing that coverage reflects programme performance and measurement, not simply provincial wealth. The low-birth-weight gap between public facilities (14.2%) and insured births (6.5%) makes the socio-economic gradient in the earliest days of life directly visible.
Is the system responding? Child health inherits the maternal domain's audit tradition: perinatal and child deaths in facilities are reviewed through the PPIP and Child PIP, feeding national mortality reports and ward-level corrective actions,75 and measles outbreaks have repeatedly triggered supplementary immunisation campaigns. Surveillance is visibly converted into action. The system has also historically corrected its own coverage statistics: the national EPI coverage survey exists precisely because administrative coverage is known to be denominator sensitive. That corrective instrument, however, was last deployed in 2019/20, so the system is currently flying on administrative estimates it knows to be distorted.76
What prevents learning? The denominator entanglement described in the preceding sections reaches its most consequential form here, because immunisation coverage is the indicator on which child health programmes are steered. Administrative coverage divides doses by projected infant populations; the recalculation of denominators to the updated mid-year estimates, therefore, moves coverage without any child being vaccinated or missed, and the international WHO/UNICEF estimates apply yet another denominator. The BCG figure makes the problem concrete: a birth-dose vaccine recording 74% coverage in a country where most births occur in facilities is measuring its denominator as much as its programme. Source divergence compounds this, with under-five mortality spanning 26 to 35 per 1 000 across the national and international estimation series in routine use, with no domestic reconciliation. The public–private comparability problem recurs in a subtler form: the medical schemes' neonatal mortality figure (0.13 per 1 000 live births) is definitionally aligned with the national indicator yet implies around fifteen neonatal deaths among 118 000 insured births, not a plausible mortality rate but a demonstration that claims data records billing events rather than vital events and cannot see the deaths of infants never registered as beneficiaries. This lesson is repeated by the schemes' BCG figure of barely one recorded dose per
1 000 insured infants. The learning risk, as elsewhere, sits downstream: a district manager rewarded or sanctioned on administrative coverage has no routine way of knowing how much of an apparent change is real. |
Table 7.Child health indicators
| Indicator |
Period |
SA |
EC |
FS |
GP |
KZ |
LP |
MP |
NC |
NW |
WC |
BCG coverage
both sexes WHO/UNICEFa |
2024 |
74 |
|
|
|
|
|
|
|
|
|
Child mortality (deaths between 1-4 years per 1 000 live births)
both sexes WHOb |
2024 |
11.1 |
|
|
|
|
|
|
|
|
|
| female WHOb |
10.4 |
|
|
|
|
|
|
|
|
|
| male WHOb |
11.8 |
|
|
|
|
|
|
|
|
|
DTP3 coverage
both sexes WHO/UNICEFa |
2024 |
74 |
|
|
|
|
|
|
|
|
|
Measles 2nd dose coverage
both sexes WHO/UNICEFa |
2024 |
82 |
|
|
|
|
|
|
|
|
|
Orphanhood
both sexes <18 years GHS doublec |
2025 |
1.6 |
2.1 |
3.4 |
1.7 |
1.5 |
1.3 |
8.3 |
5.8 |
9.7 |
1 |
| both sexes <18 years GHS maternalc |
2.3 |
3 |
8.3 |
1.7 |
2.1 |
1.6 |
3 |
2.9 |
2.8 |
2.8 |
| both sexes <18 years GHS paternalc |
7.3 |
8.4 |
2.6 |
6.4 |
8.9 |
5.6 |
8.3 |
5.8 |
9.7 |
4.3 |
PCV 3rd dose coverage
both sexes WHO/UNICEFa |
2024 |
81 |
|
|
|
|
|
|
|
|
|
Under 5 mortality rate (deaths under 5 years per 1 000 live births)
both sexes mid-yeard |
2025 |
26.1 |
|
|
|
|
|
|
|
|
|
| both sexes WHO/UNICEFe |
2024 |
35.1 |
|
|
|
|
|
|
|
|
|
| male UNIGMEf |
37.6 |
|
|
|
|
|
|
|
|
|
| female UNIGMEf |
32.4 |
|
|
|
|
|
|
|
|
|
| both sexes GBDg |
2023 |
34.9 |
|
|
|
|
|
|
|
|
|
Infant mortality rate (deaths under 1 year per 1 000 live births)
both sexes mid-yeard |
2025 |
23.1 |
|
|
|
|
|
|
|
|
|
| both sexes WHOe |
2024 |
24.2 |
|
|
|
|
|
|
|
|
|
| both sexes GBDg |
2023 |
26.8 |
|
|
|
|
|
|
|
|
|
| Indicator |
Period |
SA |
EC |
FS |
GP |
KZ |
LP |
MP |
NC |
NW |
WC |
Neonatal mortality rate (per 1000 live births)
both sexes WHOe |
2024 |
12.4 |
|
|
|
|
|
|
|
|
|
| both sexes med schemesh |
0.1 |
|
|
|
|
|
|
|
|
|
Live birth under 2500g in facility rate
both sexes DHISi |
2024/25 |
14.2 |
16.7 |
15.6 |
14.5 |
135 |
11.9 |
13.1 |
18.7 |
14.5 |
14.8 |
2024
both sexes med schemesh |
|
6.5 |
|
|
|
|
|
|
|
|
|
Mortality rate among children aged 5–14 years
both sexes UN IGMEf |
2024 |
5.4 |
|
|
|
|
|
|
|
|
|
Number of under-5 deaths
both sexes UN IGMEf |
2024 |
41 435 |
|
|
|
|
|
|
|
|
|
Immunisation under 1 year coverage
both sexes DHISi |
2024/25 |
75.1 |
61.6 |
59.4 |
84.6 |
82.9 |
66.9 |
79.5 |
63.2 |
75.7 |
72.5 |
REFERENCE NOTES
a Immunization 2025
b Global Health Observatory
c Stats SA GHS 2025
d Stats SA MYE 2025
e World Health Statistics 2026
f UNIGME 2025
g GBD 2023
h CMS 2025
i DHIS
DEFINITIONS
BCG coverage [Percentage] — The proportion of expected live born babies that received BCG under 1 year of age (note: usually given immediately after birth).
Child mortality (deaths between 1-4 years per 1 000 live births) [per 1 000 live births] — The number of children aged 12 months to 5 years (i.e. to the end of the 4th year) who die in a year, per 1 000 live births.
DTP3 coverage [Percentage] — The proportion of children who received their third DTP doses (normally at 14 weeks).
Immunisation under 1 year coverage [Percentage] — The proportion of all children in the target area under one year of age who complete their primary course of immunisation. The primary course includes BCG, OPV 1, 2 and 3, DTP-Hib 1, 2 and 3, HepB 1, 2 and 3, and the first measles dose (usually at 9 months).
Infant mortality rate (deaths under 1 year per 1 000 live births) [per 1 000 live births] — The number of children less than one year old who die in a year, per 1 000 live births during that year.
Live birth under 2500g in facility rate [Percentage] — Percentage of live births in a facility weighing under 2 500g. Previously called the low birth weight rate in DHIS.
Measles 1st dose under 1 year coverage [Percentage] — Children under 1 year who received measles 1st dose, as a proportion of population under 1 year.
Measles 2nd dose coverage [Percentage] — Children 1 year (12 months) who received measles 2nd dose, as a proportion of the 1 year population.
Mortality rate among children aged 5–14 years [per 1 000 children aged 5 years] — The probability of a child who has reached exact age 5 dying before reaching exact age 15, expressed per 1 000 children aged 5 years.
Neonatal mortality rate (per 1 000 live births) [per 1 000 live births] — Number of deaths within the first 28 days of life, in a year, per 1 000 live births during that year. Also called the neonatal death rate (NDR).
Number of under-5 deaths [Number] — The estimated number of deaths in children younger than 5 years.
Orphanhood [Percentage] — Proportion of children under 18 years whose biological mother, biological father or both parents have died.
PCV 3rd dose coverage [Percentage] — Children under 1 year who received PCV 3rd dose, normally at 9 months as a proportion of population under 1 year.
Under 5 mortality rate (deaths under 5 years per 1 000 live births) [per 1 000 live births] — The number of children under 5 years who die in a year, per 1 000 live births during the year. It is a combination of the infant mortality rate, plus the age 1-4 mortality rate.
Non-communicable diseases
As South Africa moves through the demographic and epidemiological transitions described earlier in this paper, NCDs account for a rising share of the burden of disease. Diabetes and cardiovascular disease account for the largest share of that burden, but neither has a disease-specific national surveillance source. This section therefore opens with cancer, where the data infrastructure is most developed, before turning to the domains in which the measurement gap is widest.77 Among the NCDs presented here, cancer has the most established national disease-specific surveillance source through the pathology-based National Cancer Registry, which recorded an age-standardised incidence of all cancers of 115 per 100 000 among men and 104.7 among women in 2024, with distinctly different profiles by sex (Figure 14).78 Prostate cancer dominates the male profile at 44.9 per 100 000, followed by basal cell carcinoma (35.2), and colorectal cancer (9.9). Among women, breast cancer (32.5) and cervical cancer (24.6) together account for more than half of the leading-site burden, a reminder that cervical cancer, though largely preventable through HPV vaccination and screening, remains one of the heaviest cancer burdens facing South African women (Table 8).79
Primary prevention and early detection of cervical cancer in the public sector run on two very different information systems. Cervical cancer screening coverage among women aged 30 and older stood at 40.5% in 2024/25, ranging from 66.1% in KwaZulu-Natal to 22.1% in Limpopo, a spread wider than almost any other service indicator in this paper.80 HPV vaccination, by contrast, is delivered through the Integrated School Health Programme and reported through a campaign stream rather than routine facility data, which makes its coverage difficult to establish and impossible to disaggregate provincially on the same basis as the indicators presented here. The consequences are visible in the estimates themselves. For 2024, the NDoH reported that 85–89% of girls aged 9–15 in public schools, and 75% of all South African girls, had received at least one dose, while WHO estimates for the same year place coverage at approximately 49%. The gap is unlikely to reflect disagreement about the programme so much as about its measurement, since the departmental figure rests on administrative returns while the WHO estimate draws on multiple sources and adjusts for data quality, the same distinction that separates administrative from estimated immunisation coverage in the child health section.81 For a programme that has switched to a single-dose schedule and extended to private and independent schools since 2024, and that underpins a national commitment to eliminating cervical cancer by 2030, coverage is not currently measured with the confidence that commitment implies.
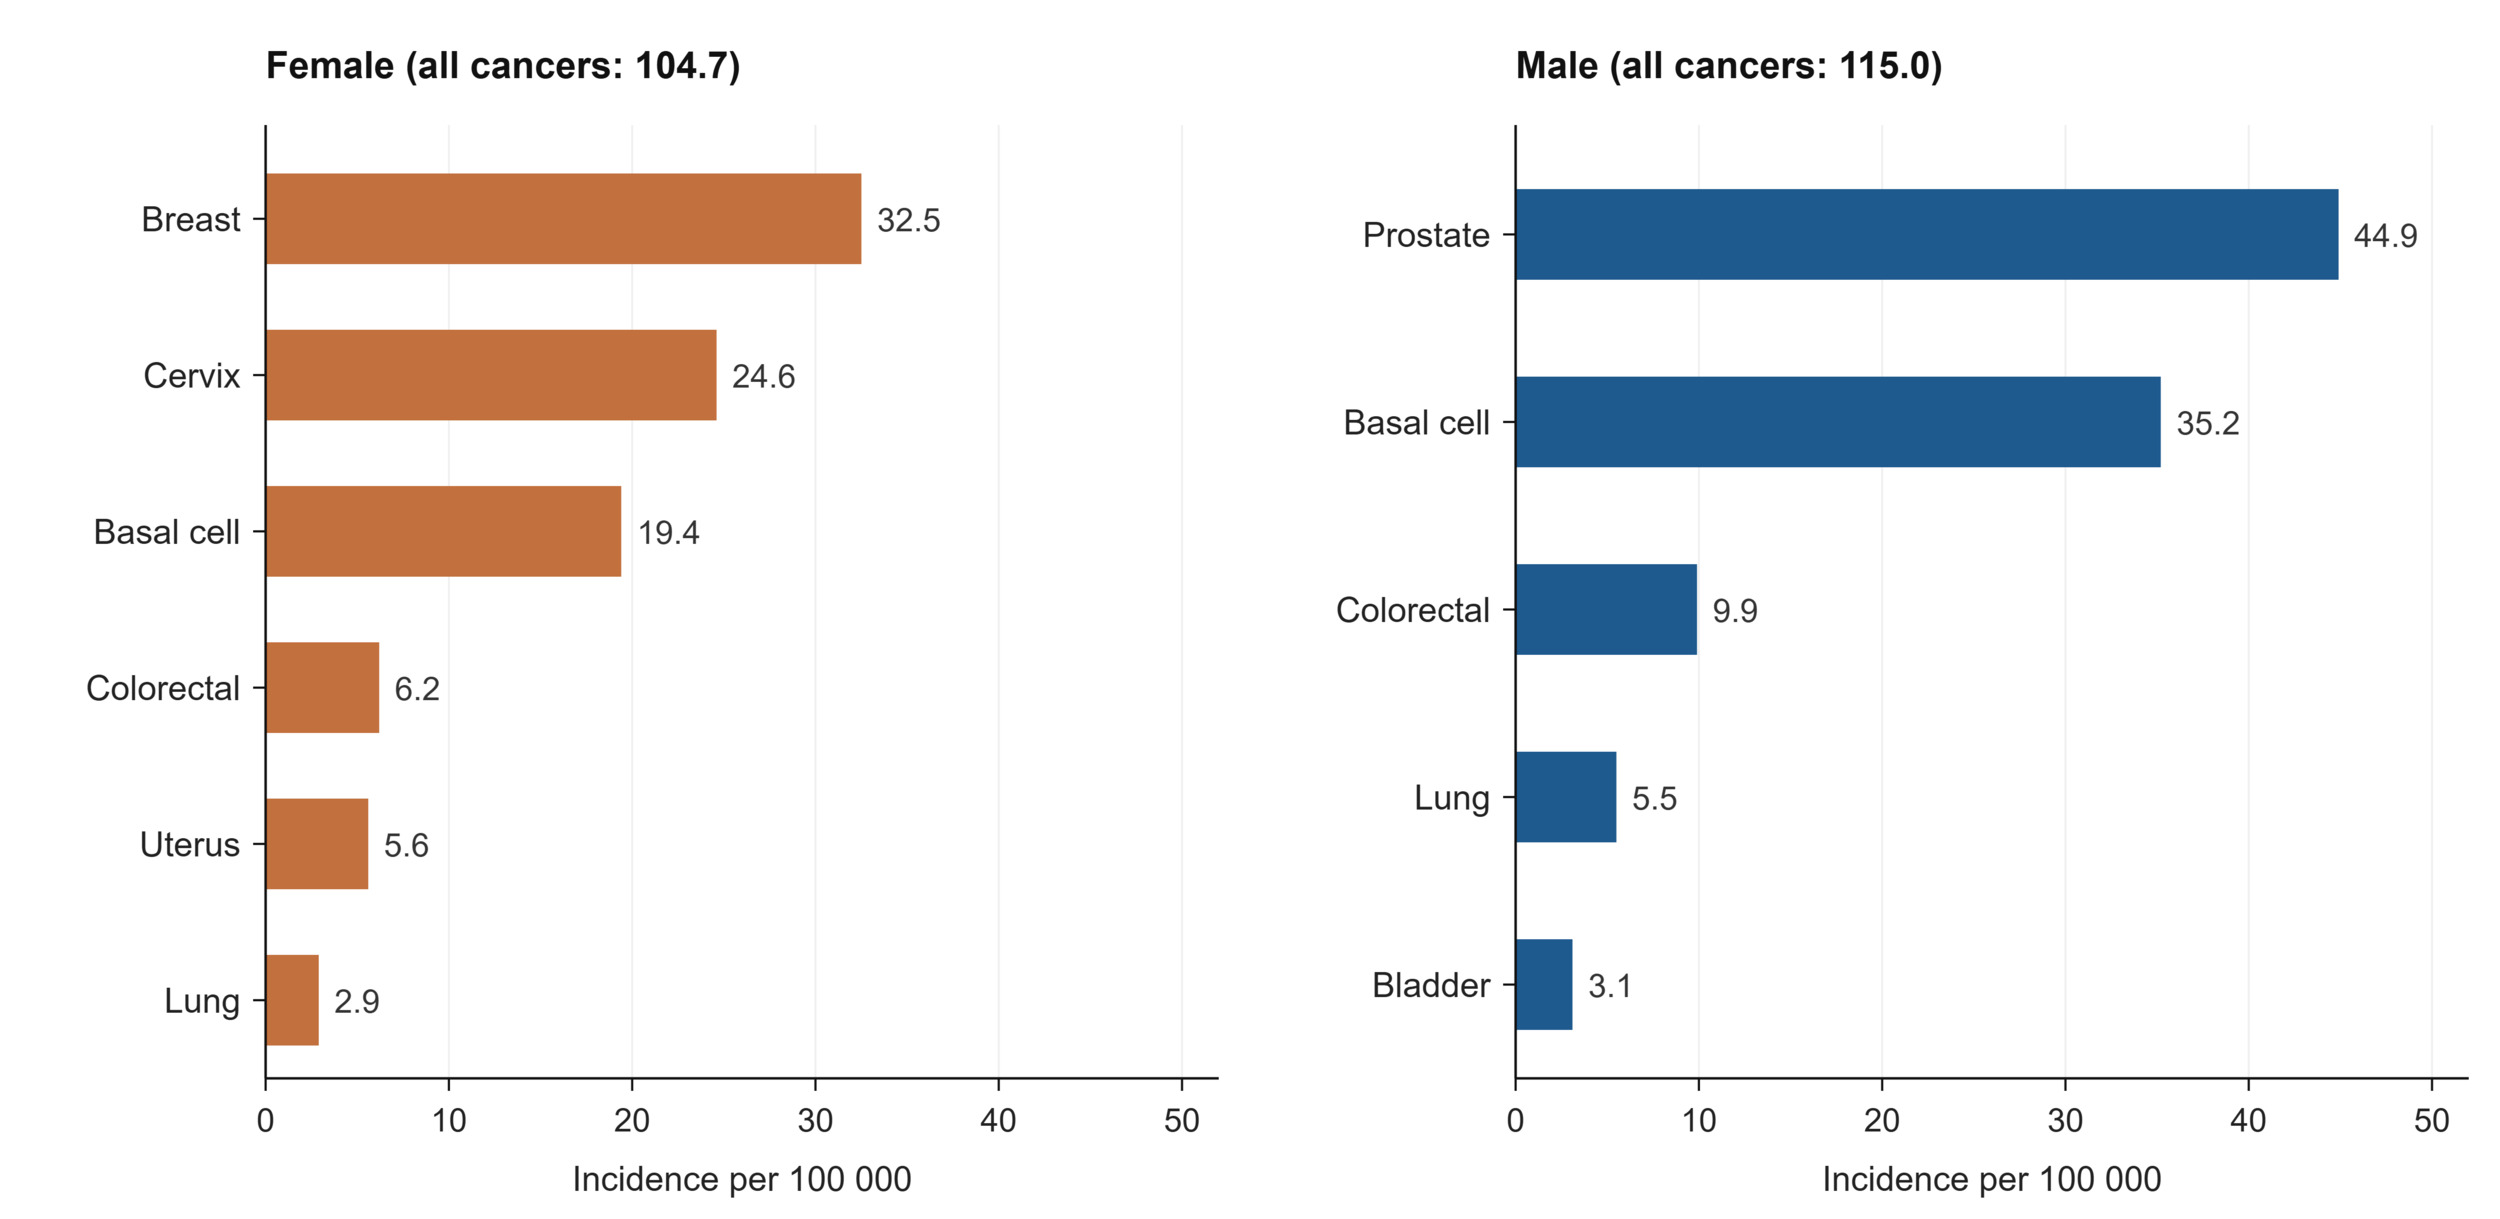
Figure 14.Leading cancer incidence by site and sex, age-standardised per 100 000, 2024
Source: National Cancer Registry, 2025.78
The private sector data tell a parallel and consistent story from a different vantage point. Among medical scheme beneficiaries, recorded cancer prevalence follows the same rank order, with breast cancer affecting 11.8 per 1 000 female beneficiaries and prostate cancer 29.2 per 1 000 male beneficiaries aged 40 and older. These figures are considerably higher than the registry’s incidence rates, as expected, since prevalence counts all beneficiaries living with a diagnosis rather than new cases in a year, and the insured population is older than the national average. Cervical cancer screening among insured women aged 30 to 49 reached 69 per 1 000, and cataract surgery, a key marker of access to elective NCD-related care, was performed at 11.3 per 1 000 beneficiaries in need.13 The public cataract surgery rate stood at 918 per million uninsured population in 2024/25, ranging widely from 299.9 in the Northern Cape to 2 261 in the Free State.32 The wide provincial variation is likely to reflect differences in surgical capacity, theatre access, workforce availability, referral systems, management practices and the efficiency with which existing eye-care resources are used.82
For the NCDs that drive the greatest share of premature death, i.e., cardiovascular disease, diabetes, and chronic respiratory disease, the routine data are markedly thinner than for cancer.83 The indicator framework is built around screening and detection: the number of clients screened for diabetes and hypertension, and the proportion of those newly diagnosed who are initiated on treatment. This reflects the National NCD Strategic Plan’s 90-60-50 cascade which sets targets for the proportion of adults who know their blood glucose and blood pressure status (90%) , who receive treatment (60%), and who achieve control (50%).84 Yet the population denominators the cascade depends on are dated: national prevalence estimates for diabetes and hypertension still derive substantially from the South African National Health and Nutrition Examination Survey (SANHANES), fielded more than a decade ago.85 The system can report how many people it screened, but not reliably what share of the affected population that represents, which is the measurement the cascade was designed to enable.
Mental health has become more visible in routine reporting, though it remains defined largely by service contacts rather than by need. In 2024/25 the mental health visit rate for adults was 91.9 per 1 000 uninsured population, and the child and adolescent attempted suicide rate was 28.1 per 100 000, highest in the Eastern Cape (34.4) and Mpumalanga (31.3). Involuntary admission rates vary strikingly, from 4.6 per 100 000 in the Free State to 134.4 in the Northern Cape, a range too wide to represent differences in underlying illness and more likely reflecting provincial differences in bed availability, admission practice, and recording.32 At national level, the Global Mind Project’s Mental Health Quotient scored South Africa at 61.9 in 2025, with a notable gap between men (68.6) and women (55.7).86 In the private sector, 77.8 per 1 000 beneficiaries were recorded with depression and 5.1 per 1 000 with psychosis, figures that describe care-seeking among the insured rather than prevalence in the population. Across the mental health indicators, the recurring absence is the same one that limits the NCD domain as a whole: a measured denominator of need against which services can be judged.13
Learning signals: non-communicable diseases
What does the data reveal? NCDs are where the system's data is thinnest relative to the size of the burden. Cancer incidence is well characterised, with sex-specific profiles led by prostate cancer in men and breast and cervical cancer in women, and the private data confirms the same hierarchy at much higher recorded prevalence among an older, insured population. Beyond cancer, however, the routine indicators capture services delivered rather than disease present for diabetes and hypertension, the two conditions driving the bulk of premature NCD mortality. The system can describe how many people it screened without being able to say how many people are affected. Mental health shows the same shape, with service-contact rates available while community prevalence is not, and involuntary admission rates varying more than tenfold between provinces.
Is the system responding? The policy architecture is in place. The National NCD Strategic Plan sets a 90-60-50 cascade for diabetes and hypertension (90% diagnosed, 60% treated, 50% controlled) and aligns with the global target of reducing premature NCD mortality by a third by 2030, and the screening indicators in this domain show the first rung of that cascade being counted.84 Mental health has moved onto the routine reporting agenda for the first time in recent years, which is itself a signal of institutional attention. The difficulty is that a cascade cannot be monitored without a denominator: reporting screening volumes reveals effort, but without a measured prevalence base the system cannot know what share of people it is reaching, which is the question the cascade was designed to answer.
What prevents learning? The binding constraint is the absence of a recent national health examination survey. Diabetes and hypertension prevalence rest on SANHANES, now more than a decade old, so the system tracks its NCD response against a denominator that predates much of the epidemiological transition it is meant to measure. The routine data that does exist measures the wrong end of the pathway, counting clinical activity rather than population burden, and some of it carries visible instability across provinces, patterns that point to denominator and recording differences rather than genuine variations of magnitude. Mental health illustrates the ceiling on learning most sharply: with prevalence unmeasured, a tenfold provincial range in involuntary admissions cannot be interpreted as need, practice, bed availability or reporting, and the composite Mental Health Quotient available at national level offers no sub-national traction. The private sector's high recorded rates of depression and psychosis describe insured claimants rather than the population, and so cannot fill the gap. Across NCDs, the system is well set up to count what it does and poorly set up to learn what is happening to the people it does not see. |
Table 8.Non-communicable diseases indicators
| Indicator |
Period |
SA |
EC |
FS |
GP |
KZ |
LP |
MP |
NC |
NW |
WC |
Cancer incidence rate, by type of cancer (per 100 000 population)
female age-standardised NCR all cancersa |
2024 |
104.7 |
|
|
|
|
|
|
|
|
|
| female age-standardised NCR uterusa |
5.6 |
|
|
|
|
|
|
|
|
|
| female age-standardised NCR breasta |
32.5 |
|
|
|
|
|
|
|
|
|
| female age-standardised NCR cervixa |
24.6 |
|
|
|
|
|
|
|
|
|
| female age-standardised NCR colorectala |
6.2 |
|
|
|
|
|
|
|
|
|
| female age-standardised NCR lunga |
2.9 |
|
|
|
|
|
|
|
|
|
| female age-standardised NCR basal cell carcinomaa |
19.4 |
|
|
|
|
|
|
|
|
|
| male age-standardised NCR all cancers a |
115 |
|
|
|
|
|
|
|
|
|
| male age-standardised NCR bladdera |
3.1 |
|
|
|
|
|
|
|
|
|
| male age-standardised NCR basal cell carcinomaa |
35.2 |
|
|
|
|
|
|
|
|
|
| male age-standardised NCR colorectala |
9.9 |
|
|
|
|
|
|
|
|
|
| male age-standardised NCR lunga |
5.5 |
|
|
|
|
|
|
|
|
|
| male age-standardised NCR prostatea |
44.9 |
|
|
|
|
|
|
|
|
|
Cervical cancer screening coverage
DHISc |
2024/25 |
40.0 |
44.7 |
37.9 |
27.4 |
66.1 |
22.1 |
47.8 |
38.0 |
56.6 |
24.8 |
Child and adolescent attempted suicide rate
DHISc |
2024/25 |
28.1 |
34.4 |
25.3 |
28 |
24.4 |
28.6 |
31.3 |
26.4 |
23 |
22.6 |
Dental extraction to restoration ratio
DHISc |
2024/25 |
13.4 |
34.9 |
30.4 |
6.2 |
16.6 |
22.2 |
19.4 |
67.8 |
25.7 |
13.5 |
Dental utilisation rate
DHISc |
2024/25 |
44.4 |
44.5 |
38.5 |
55.5 |
41.9 |
30.7 |
35.7 |
37.1 |
31.5 |
53.3 |
Mental health involuntary admission rate
DHISc |
2024/25 |
40.3 |
82.2 |
4.6 |
40.9 |
63.6 |
64.3 |
76.4 |
134.4 |
30.3 |
61.9 |
Mental Health Quotient
Both sexes all ages MHQb |
2025 |
61.9 |
|
|
|
|
|
|
|
|
|
| female all ages MHQb |
55.6 |
|
|
|
|
|
|
|
|
|
| male all ages MHQb |
68.6 |
|
|
|
|
|
|
|
|
|
Mental health separation rate
DHISc |
2024/25 |
4.1 |
2.8 |
22.3 |
2.3 |
2.4 |
2.9 |
2 |
1.2 |
1.8 |
4.3 |
Mental health visit 18 years and older rate
DHISc |
2024/25 |
91.9 |
96.4 |
88.5 |
86.7 |
93.6 |
95.5 |
93.8 |
94.9 |
92.7 |
92.1 |
Cataract surgery rate
DHISc |
2024/25 |
918 |
494.4 |
2 261 |
829.9 |
1 665 |
343.5 |
577.2 |
299.9 |
489.3 |
811.5 |
Spectacles issued to an adult rate
DHISc |
2024/25 |
60.9 |
59.2 |
47.6 |
54.4 |
62.7 |
52.5 |
46.6 |
127.1 |
88.9 |
67.3 |
Spectacles issued to child rate
DHISc |
2024/25 |
56.9 |
32.4 |
49.1 |
47.2 |
62.1 |
66.2 |
55.5 |
34 |
120.1 |
58.3 |
REFERENCE NOTES
a NCR 2024
b Global Mind Project 2025
c DHIS
DEFINITIONS
Cancer incidence rate, by type of cancer (per 100 000 population) [per 100 000 population] — Number of new cancers of a specific site/type occurring per 100 000 population. Numerator: Number of new cancer cases diagnosed in a specific year. This may include multiple primary cancers occurring in one patient. The primary site reported is the site of origin and not the metastatic site. In general, the incidence rate would not include recurrences. Denominator: The at-risk population for the given category of cancer. The population used depends on the rate to be calculated. For cancer sites that occur only in one sex, the sex-specific population (e.g. females for cervical cancer) is used.
Cataract surgery rate [per 1 million population] — Clients who had cataract surgery per 1 million uninsured population.
Cervical cancer screening coverage [Percentage] — Cervical smears in women 30 years and older as a proportion of the female population 30 years and older. 80% of these women should be screened for cervical cancer every 10 years and 20% must be screened every 3 years which should be included in the denominator because it is estimated that 20% of women 30 years and older are HIV positive.
Child and adolescent attempted suicide rate [per 100 000 population] — Children and adolescents treated at a health facility following a suicide attempt, per 100 000 of the uninsured population in that age group.
Dental extraction to restoration ratio [Number] — The ratio between the number of teeth extracted and the number of teeth restored. The national target ratio is 10:1.
Dental utilisation rate [per 1 000 population] — Dental visits per 1 000 uninsured population.
Mental health involuntary admission rate [Percentage] — Involuntary mental health admissions, made in terms of the Mental Health Care Act, as a proportion of all mental health admissions.
Mental Health Quotient [Number] — An aggregate metric of mental wellbeing that positions individuals on a spectrum from distressed to thriving. The positive range of the scale represents normal functioning and is a 200-point scale calibrated to a mean of 100 based on pre-pandemic responses in 2019, similar to the IQ scale. The negative range represents scores associated with a negative impact on the ability to function.
Mental health separation rate [Percentage] — Proportion of clients admitted for mental health problems. Inpatient separations is the total of inpatient discharges, inpatient deaths and inpatient transfers out.
Mental health visit 18 years and older rate [Percentage] — Mental health visits by clients 18 years and older as a proportion of total PHC headcount 18 years and older.
Spectacles issued to an adult rate [Percentage] — Spectacles issued to clients aged 19 years and above as a proportion of the applications received for clients aged 19 years and above.
Spectacles issued to child rate [Percentage] — Spectacles issued to children aged 7–18 years as a proportion of the applications received for children aged 7–18 years.
Nutrition
South Africa’s nutritional profile is defined by a double burden: persistent childhood undernutrition alongside widespread overweight and obesity, sometimes within the same individual or household. A national South African analysis found that more than 70% of stunted children lived with an overweight or obese adult (Figure 15).87 Among children under five, stunting affects between a quarter and nearly a third of the age group, estimated at 24.4% by the WHO and 28.8% by the 2023 National Food and Nutrition Security Survey (NFNSS).88 Stunting reflects chronic nutritional deprivation in the first thousand days of life and carries lifelong consequences for cognitive development and later disease risk.89 At the same time, 12.8% of children under five are already overweight, an early sign of the over-nutrition that becomes dominant in adulthood.54 These national figures sit within a global picture of stalled progress: the WHO reports that stunting, low birth weight, childhood overweight, and anaemia in women of reproductive age are all off-track against the 2030 nutrition targets, and that exclusive breastfeeding, though improving, remains short of its goal (Table 9).90
Acute undernutrition, though less prevalent than stunting, is more immediately dangerous and highly concentrated geographically. South African hospital evidence confirms that severe acute malnutrition (SAM) is a life-threatening condition associated with substantial mortality. In a Limpopo study of 956 admitted children, 25.9% died, with mortality associated with severe wasting, HIV, hypoglycaemia, anaemia, respiratory infection, and poor appetite.91 National child wasting was 5.3% in 2023, but reached 23.8% in the Northern Cape, more than four times the national figure. The same province recorded the highest child underweight (27.6% against 7.7% nationally) and the highest proportion of households with severely inadequate access to food (23.4% against 9% nationally), marking it as the country’s clearest concentration of acute food deprivation.8,88 Severe acute malnutrition remains a cause of preventable child death: the SAM death rate among children under five was 15.1 per 1 000 SAM cases nationally in 2024/25, highest in Mpumalanga (23.0), the Eastern Cape (18.5) and KwaZulu-Natal (17.5). The geography of SAM deaths does not perfectly match the geography of detection, since the highest in-facility SAM rates were recorded in the Northern Cape and Eastern Cape, a divergence that speaks to where children are reached as much as to where they fall ill.32
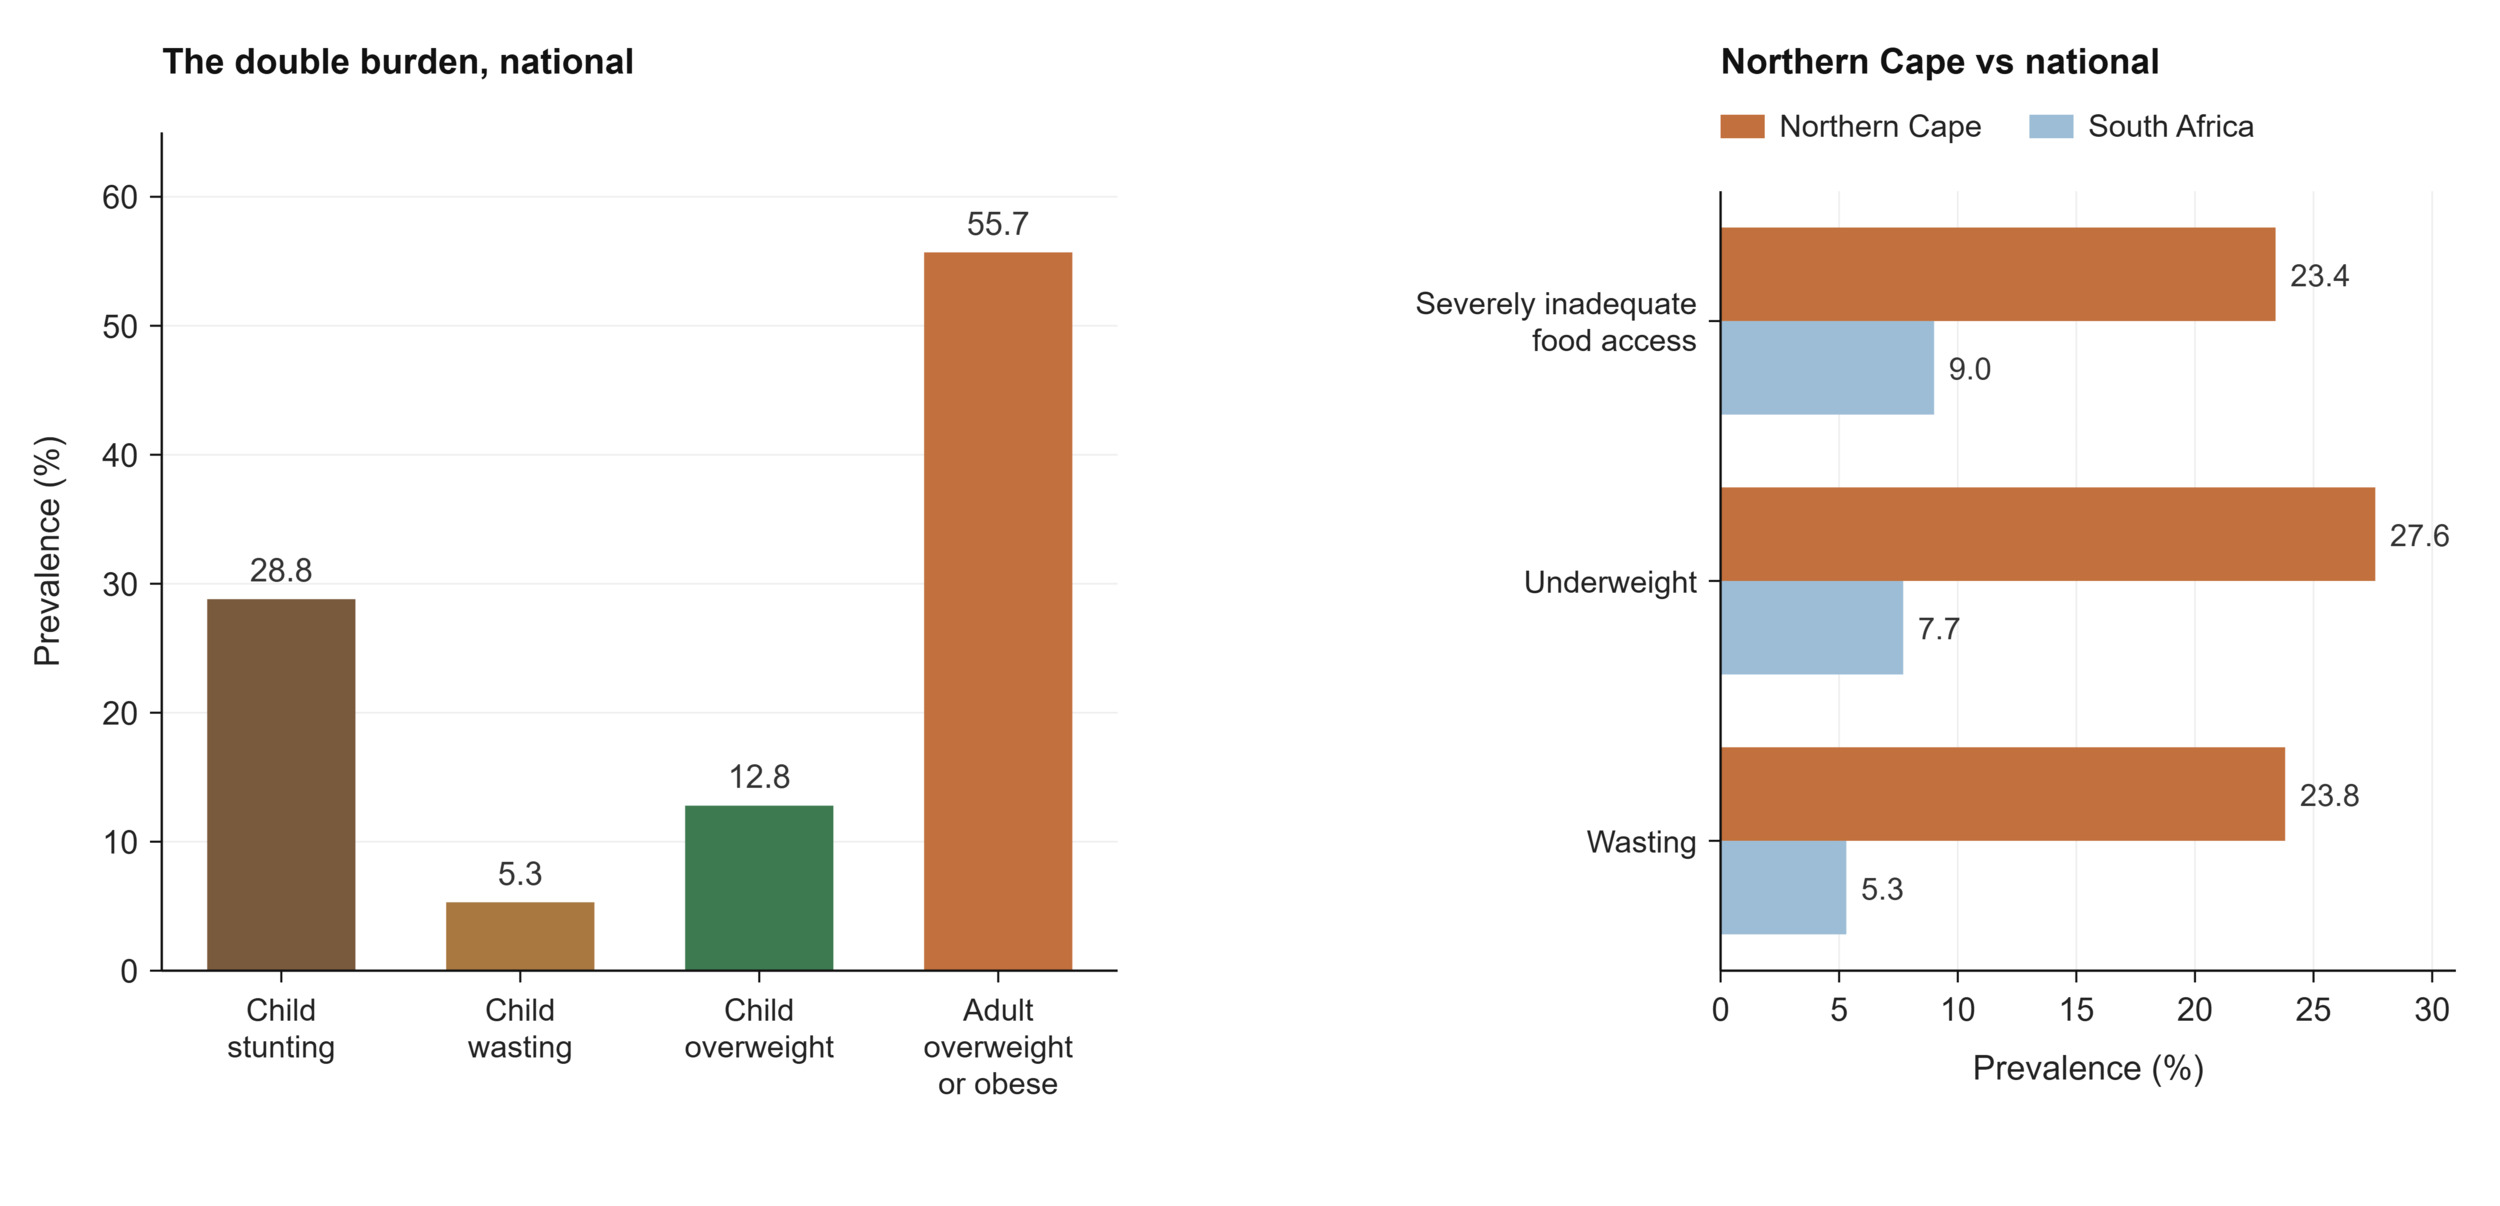
Figure 15.The double burden of malnutrition, and the concentration of acute undernutrition in the Northern Cape, 2023-2025
Source: NFNSS, 202388; GHS, 20268; WHO, 2026.90
In adulthood, over-nutrition dominates, and it is strongly gendered. WHO age-standardised estimates put 55.7% of adults as overweight or obese, but the sex disaggregation is stark: 72.5% of women against 37.6% of men.92 The NFNSS records the same asymmetry from a domestic vantage point, with adult female obesity at 41.3% against 15.3% in men, and places female obesity highest in KwaZulu-Natal (51.9%).88 The gradient begins early, with 30% of girls aged 10 to 19 already overweight against 15.2% of boys.92 The scale of adult obesity, particularly among women, is one of the primary modifiable drivers of the cardiovascular disease and diabetes burden discussed in the NCDs section, linking the two domains directly. The coexistence of this over-nutrition with the acute undernutrition concentrated in provinces such as the Northern Cape, sometimes within the same households, is the defining feature of the South African nutritional transition.
The health system’s routine nutritional indicators focus on early-life interventions. Vitamin A supplementation coverage among children aged 12 to 59 months was 66.9% in 2024/25, ranging from 47.4% in both Limpopo and the Northern Cape, to 83.6% in KwaZulu-Natal. Exclusive breastfeeding, measured at the third hexavalent vaccination visit at around 14 weeks, stood at 43.9% nationally, ranging from 33.5% in Limpopo to 56.9% in KwaZulu-Natal.32 Both indicators sit below their programmatic targets, and both describe the delivery of an intervention rather than a child’s nutritional status. Beyond these, the drivers of the nutritional profile are structural, rooted in the affordability and marketing of energy-dense food, the socio-economic conditions described at the start of this paper, and the food environment more broadly. South Africa has responded with population-level instruments that are ambitious by regional standards, including mandatory sodium reduction targets for processed foods and a Health Promotion Levy on sugar-sweetened beverages introduced in 2018.93 Evaluation evidence suggests that these measures are affecting intermediate outcomes. The announcement and implementation of the Health Promotion Levy were followed by reductions in the sugar, calories and volume of purchased taxable beverages, while longitudinal research has associated South Africa’s sodium regulations with reductions in sodium intake and blood pressure. However, these evaluations remain largely research-based rather than embedded in routine surveillance, and nationally representative data are not collected frequently enough to determine whether the policies are producing sustained changes in dietary intake, obesity or NCD outcomes.33
Learning signals: nutrition
What does the data reveal? South Africa carries both ends of the malnutrition spectrum at once. Roughly a quarter to a third of children under five are stunted, while more than half of adults are overweight or obese, and the two conditions co-exist within the same provinces and households. The adult burden is sharply gendered, with nearly three-quarters of women overweight or obese against just over a third of men. Beneath the national averages, acute undernutrition remains concentrated and lethal in specific provinces: NC records the highest child wasting, underweight and food-access deprivation, while SAM still kills most heavily in MP, EC and KZ. Undernutrition and overweight are shaped by interconnected food-system and socioeconomic conditions. Life-course exposure to early undernutrition followed by overweight or obesity may further increase the risk of diabetes and cardiovascular disease.
Is the system responding? Several levers are visible. Routine services deliver vitamin A supplementation and promote exclusive breastfeeding in the public sector, and South Africa has legislated some of the more ambitious food environment policies in the region, including mandatory salt reduction in processed foods and a sugar-sweetened beverage levy.93 These align with the global direction of travel: the WHO's comprehensive implementation plan on maternal, infant and young child nutrition, extended to 2030, now counts breastfeeding support among the best buys for reducing NCDs.90,94 The presence of the NFNSS and the addition of SAM and household food access indicators to routine reporting show a system trying to see the problem more clearly. What is missing is the connective tissue: nutrition sits across health, agriculture, social development, and trade, and no single information system draws these together, so the country can legislate on the food environment without routinely observing whether it is shifting the population distributions it targets.
What prevents learning? Nutrition depends heavily on periodic surveys, which leaves long blind spots between data points and forces the system to steer using measures that may be several years old. The national picture also depends on which instrument is consulted: child stunting is reported at 24.4% by the WHO and 28.8% by the NFNSS, and the two-household food-access sources diverge substantially, with the NFNSS placing severe food inadequacy at 17.5% nationally against the GHS figure of 9%, a gap that reflects different questionnaires and reference periods rather than a real change. The routine service indicators measure inputs rather than status: vitamin A coverage and breastfeeding rates describe what services do, not whether children are adequately nourished, and both carry denominator sensitivities, with vitamin A coverage ranging from 47% to 84% across provinces partly through differences in target-population estimates. Even the SAM indicators, valuable as they are, capture only children who reach a facility, so provinces with the highest in-facility case rates may be those with better detection rather than more disease. The deepest gap remains intersectoral: the determinants of nutrition lie largely outside the health sector, yet the data systems remain siloed within it, so the learning loop for the country's single largest modifiable driver of NCDs is among the weakest in this paper. |
Table 9.Nutrition indicators
| Indicator |
Period |
SA |
EC |
FS |
GP |
KZ |
LP |
MP |
NC |
NW |
WC |
Infant exclusively breastfed at DTaP-IPV-Hib-HBV 3rd dose rate
both sexes DHISa |
2024/25 |
43.9 |
40 |
37.9 |
47.3 |
56.9 |
33.5 |
35.1 |
49.1 |
34.9 |
39.8 |
Obesity
both sexes 5-9 years WHO crude estimatesb |
2024 |
7.7 |
|
|
|
|
|
|
|
|
|
| both sexes 5-19 years WHO crude estimatesb |
7.8 |
|
|
|
|
|
|
|
|
|
| both sexes 10-19 years WHO crude estimatesb |
7.9 |
|
|
|
|
|
|
|
|
|
| female 5-9 years WHO crude estimatesb |
8.4 |
|
|
|
|
|
|
|
|
|
| female 5-19 years WHO crude estimatesb |
9.5 |
|
|
|
|
|
|
|
|
|
| female 10-19 years WHO crude estimatesb |
10 |
|
|
|
|
|
|
|
|
|
| male 5-9 years WHO crude estimatesb |
7 |
|
|
|
|
|
|
|
|
|
| male 5-19 years WHO crude estimatesb |
6.2 |
|
|
|
|
|
|
|
|
|
| male 10-19 years WHO crude estimatesb |
5.8 |
|
|
|
|
|
|
|
|
|
| female >18 years NFNSSc |
2023 |
41.3 |
39.4 |
41.1 |
38.3 |
51.9 |
41.5 |
37.9 |
36.6 |
35.5 |
40.4 |
| male >18 years NFNSSc |
15.3 |
16.4 |
6.9 |
18.8 |
15 |
9.5 |
13.8 |
9.4 |
7.4 |
20.8 |
Overweight
both sexes 5-9 years WHO crude estimatesb |
2024 |
20.3 |
|
|
|
|
|
|
|
|
|
| both sexes 5-19 years WHO crude estimatesb |
21.8 |
|
|
|
|
|
|
|
|
|
| both sexes 10-19 years WHO crude estimatesb |
22.6 |
|
|
|
|
|
|
|
|
|
| female 5-9 years WHO crude estimatesb |
22.1 |
|
|
|
|
|
|
|
|
|
| female 5-19 years WHO crude estimatesb |
27.4 |
|
|
|
|
|
|
|
|
|
| female 10-19 years WHO crude estimatesb |
30 |
|
|
|
|
|
|
|
|
|
| male 5-9 years WHO crude estimatesb |
18.5 |
|
|
|
|
|
|
|
|
|
| male 5-19 years WHO crude estimatesb |
16.3 |
|
|
|
|
|
|
|
|
|
| male 10-19 years WHO crude estimatesb |
15.2 |
|
|
|
|
|
|
|
|
|
| female > 18 years NFNSSc |
2023 |
26.6 |
27.5 |
25.8 |
28.9 |
25.8 |
27.1 |
28 |
18.3 |
19.9 |
26.8 |
| male > 18 years NFNSSc |
22.9 |
21.3 |
16.3 |
27.9 |
21.4 |
13.1 |
17.4 |
14 |
16.2 |
32.2 |
| both sexes <5 years WHOd |
2024 |
12.8 |
|
|
|
|
|
|
|
|
|
Percentage of adults overweight or obese
both sexes 18 years and older WHO age-standardisedb |
2024 |
56.0 |
|
|
|
|
|
|
|
|
|
| female 18 years and older WHO age-standardisedb |
72.5 |
|
|
|
|
|
|
|
|
|
| male 18 years and older WHO age-standardisedb |
14.5 |
|
|
|
|
|
|
|
|
|
Stunting
both sexes <5 years WHOd |
2024 |
24.4 |
|
|
|
|
|
|
|
|
|
| both sexes <5 years All stuntingc |
2023 |
28.8 |
33.3 |
32.1 |
23.9 |
27.5 |
14.9 |
21.8 |
46.2 |
30.3 |
46.4 |
Underweight
both sexes 18 years and older WHO age-standardisedb |
2022 |
5.2 |
|
|
|
|
|
|
|
|
|
| female 18 years and older WHO age-standardisedb |
2.5 |
|
|
|
|
|
|
|
|
|
| male 18 years and older WHO age-standardisedb |
8.2 |
|
|
|
|
|
|
|
|
|
| both sexes <5 years all underweight NFNSSc |
2023 |
7.7 |
5.3 |
11.4 |
7.7 |
4.4 |
8.8 |
8.4 |
27.6 |
14.4 |
5.3 |
Vitamin A dose 12-59 months coverage
both sexes DHISa |
2024/25 |
66.9 |
66.3 |
53.6 |
70.3 |
83.6 |
47.4 |
82.7 |
47.4 |
60.4 |
51.2 |
Wasting
both sexes <5 years all wasting NFNSSc |
2023 |
5.3 |
3.8 |
4.3 |
6.8 |
2.1 |
6.6 |
7.4 |
23.8 |
5.3 |
3.8 |
Child under 5 years severe acute malnutrition case fatality rate
both sexes DHISa |
2024/25 |
11.0 |
8.3 |
6.8 |
6.4 |
10.7 |
6.4 |
6.3 |
1.7 |
2.2 |
6.9 |
Child under 5 years severe acute malnutrition in
facility rate
both sexes DHISa |
2024/25 |
6.1 |
10.7 |
3.2 |
5 |
6.5 |
4.3 |
9.5 |
12.3 |
0.6 |
4 |
Severe acute malnutrition death under 5 years rate
both sexes DHISa |
2024/25 |
15.1 |
18.5 |
9.8 |
13.4 |
17.5 |
9.6 |
23 |
5.6 |
2.8 |
12.5 |
Percentage of households with inadequate or severely inadequate access to food
both sexes GHS severely inadequatee |
2025 |
9.0 |
11.5 |
7.6 |
5.7 |
13.5 |
1.7 |
14.2 |
23.4 |
13.6 |
6.2 |
| both sexes GHS inadequatee |
2025 |
13.1 |
19.3 |
14.5 |
13 |
14.5 |
4.3 |
9.9 |
19.6 |
18.7 |
10.2 |
| both sexes NFNSS severely inadequatec |
2023 |
17.5 |
20 |
22 |
14 |
17 |
12 |
22 |
21 |
25 |
17 |
REFERENCE NOTES
a DHIS
b Our World in Data
c National Food and Nutrition Security Survey 2023
d World Health Statistics 2026
e GHS 2025
DEFINITIONS
Infant exclusively breastfed at DTaP-IPV-Hib-HBV 3rd dose rate [Percentage] — Infants exclusively breastfed at 14 weeks as a proportion of the DTaP-IPV-Hib-HBV 3rd dose vaccination. Take note that DTaP-IPV-Hib-HBV 3rd dose (Hexavalent) was implemented in 2015 to include the HepB dose.
Child under 5 years severe acute malnutrition case fatality rate — Severe acute malnutrition deaths in children under 5 years as a proportion of severe acute malnutrition (SAM) under 5 years in health facilities.
Child under 5 years severe acute malnutrition in facility rate — Severe acute malnutrition under 5 years as a proportion of total nutritional assessments under 5 years in facility.
Obesity [Percentage] — Percentage of people with a body mass index (BMI) (body mass in kg divided by the square of the height in m) equal to or more than 30kg/m2.
Overweight [Percentage] — Children: Proportion of children with weight for height over 2 standard deviations from the norm (reference population median). Adults: Percentage of people with body mass index (BMI) of 25-29.9 kg/m2. BMI is weight in kg divided by the square of height in m. WHO Core indicators for children under 5 years of age and adults (aged 18+ years). Rates in adults to be age-standardised. In adolescents the definitions of overweight and obesity vary by age and gender.
Percentage of adults overweight or obese [Percentage] — Percentage of adults (15+ years) who are either overweight or obese according to standard BMI cut-offs.
Percentage of households with inadequate or severely inadequate access to food — Measures the prevalence of households unable to regularly obtain sufficient, safe, and nutritious food.
Severe acute malnutrition death under 5 years rate — Severe acute malnutrition deaths in children under 5 years as a proportion of total deaths in facility under 5 years.
Stunting [Percentage] — Proportion of children with height for age under 2 standard deviations from the norm (reference population median).
Underweight [Percentage] — Children: Proportion of children with weight for age under 2 standard deviations from the norm (reference population median). Adults: Percentage of people with body mass index (BMI) <18.5 kg/m2. BMI is weight in kg divided by the square of height in m.
Vitamin A dose 12-59 months coverage [Percentage] — Proportion of children 12-59 months who received vitamin A 200 000 units, preferably every six months. The denominator is therefore the target population 1-4 years multiplied by 2.
Wasting [Percentage] — Proportion of children with weight for height under 2 standard deviations from the norm (reference population median).
Injuries, violence and behavioural risk factors
South Africa carries an exceptionally high burden of interpersonal violence and injury. National injury-mortality studies identify homicide and road-traffic injury as the country’s leading causes of injury death, with the burden falling particularly heavily on young men.95 In 2024/25 the South African Police Service (SAPS) recorded 24 692 murders, a figure that, though down more than 10% from 27 621 the previous year, still translates to a national murder rate of approximately 39 per 100 000 population, roughly six times the global average of 5.8 per 100 000.96,97 A total of 51 012 sexual offences were recorded in the same year, a national rate of about 81 per 100 000, though this figure is widely understood to represent only a fraction of true incidence given the substantial under-reporting of sexual crime (Table 10).97,98
The provincial geography of violence is uneven, and it differs by the type of violence (Figure 16). Murder is concentrated in the Eastern Cape (66.2 per 100 000), the Western Cape (57.3) and KwaZulu-Natal (44.1), the last two shaped substantially by organised and gang-related violence, while Limpopo records the lowest rate by a wide margin (12.3).99 Recorded sexual offences, however, peak in a different configuration, highest in the Free State (118.1 per 100 000), the Eastern Cape (108.4) and the Northern Cape (105.8), and lowest in Gauteng (64.0).97 That the map of homicide does not match the map of recorded sexual violence is itself informative because it points to distinct drivers and, equally, to provincial differences in the willingness and ability of victims to report, so the sexual-offence pattern should be read as a measure of recorded crime rather than of underlying risk alone.98
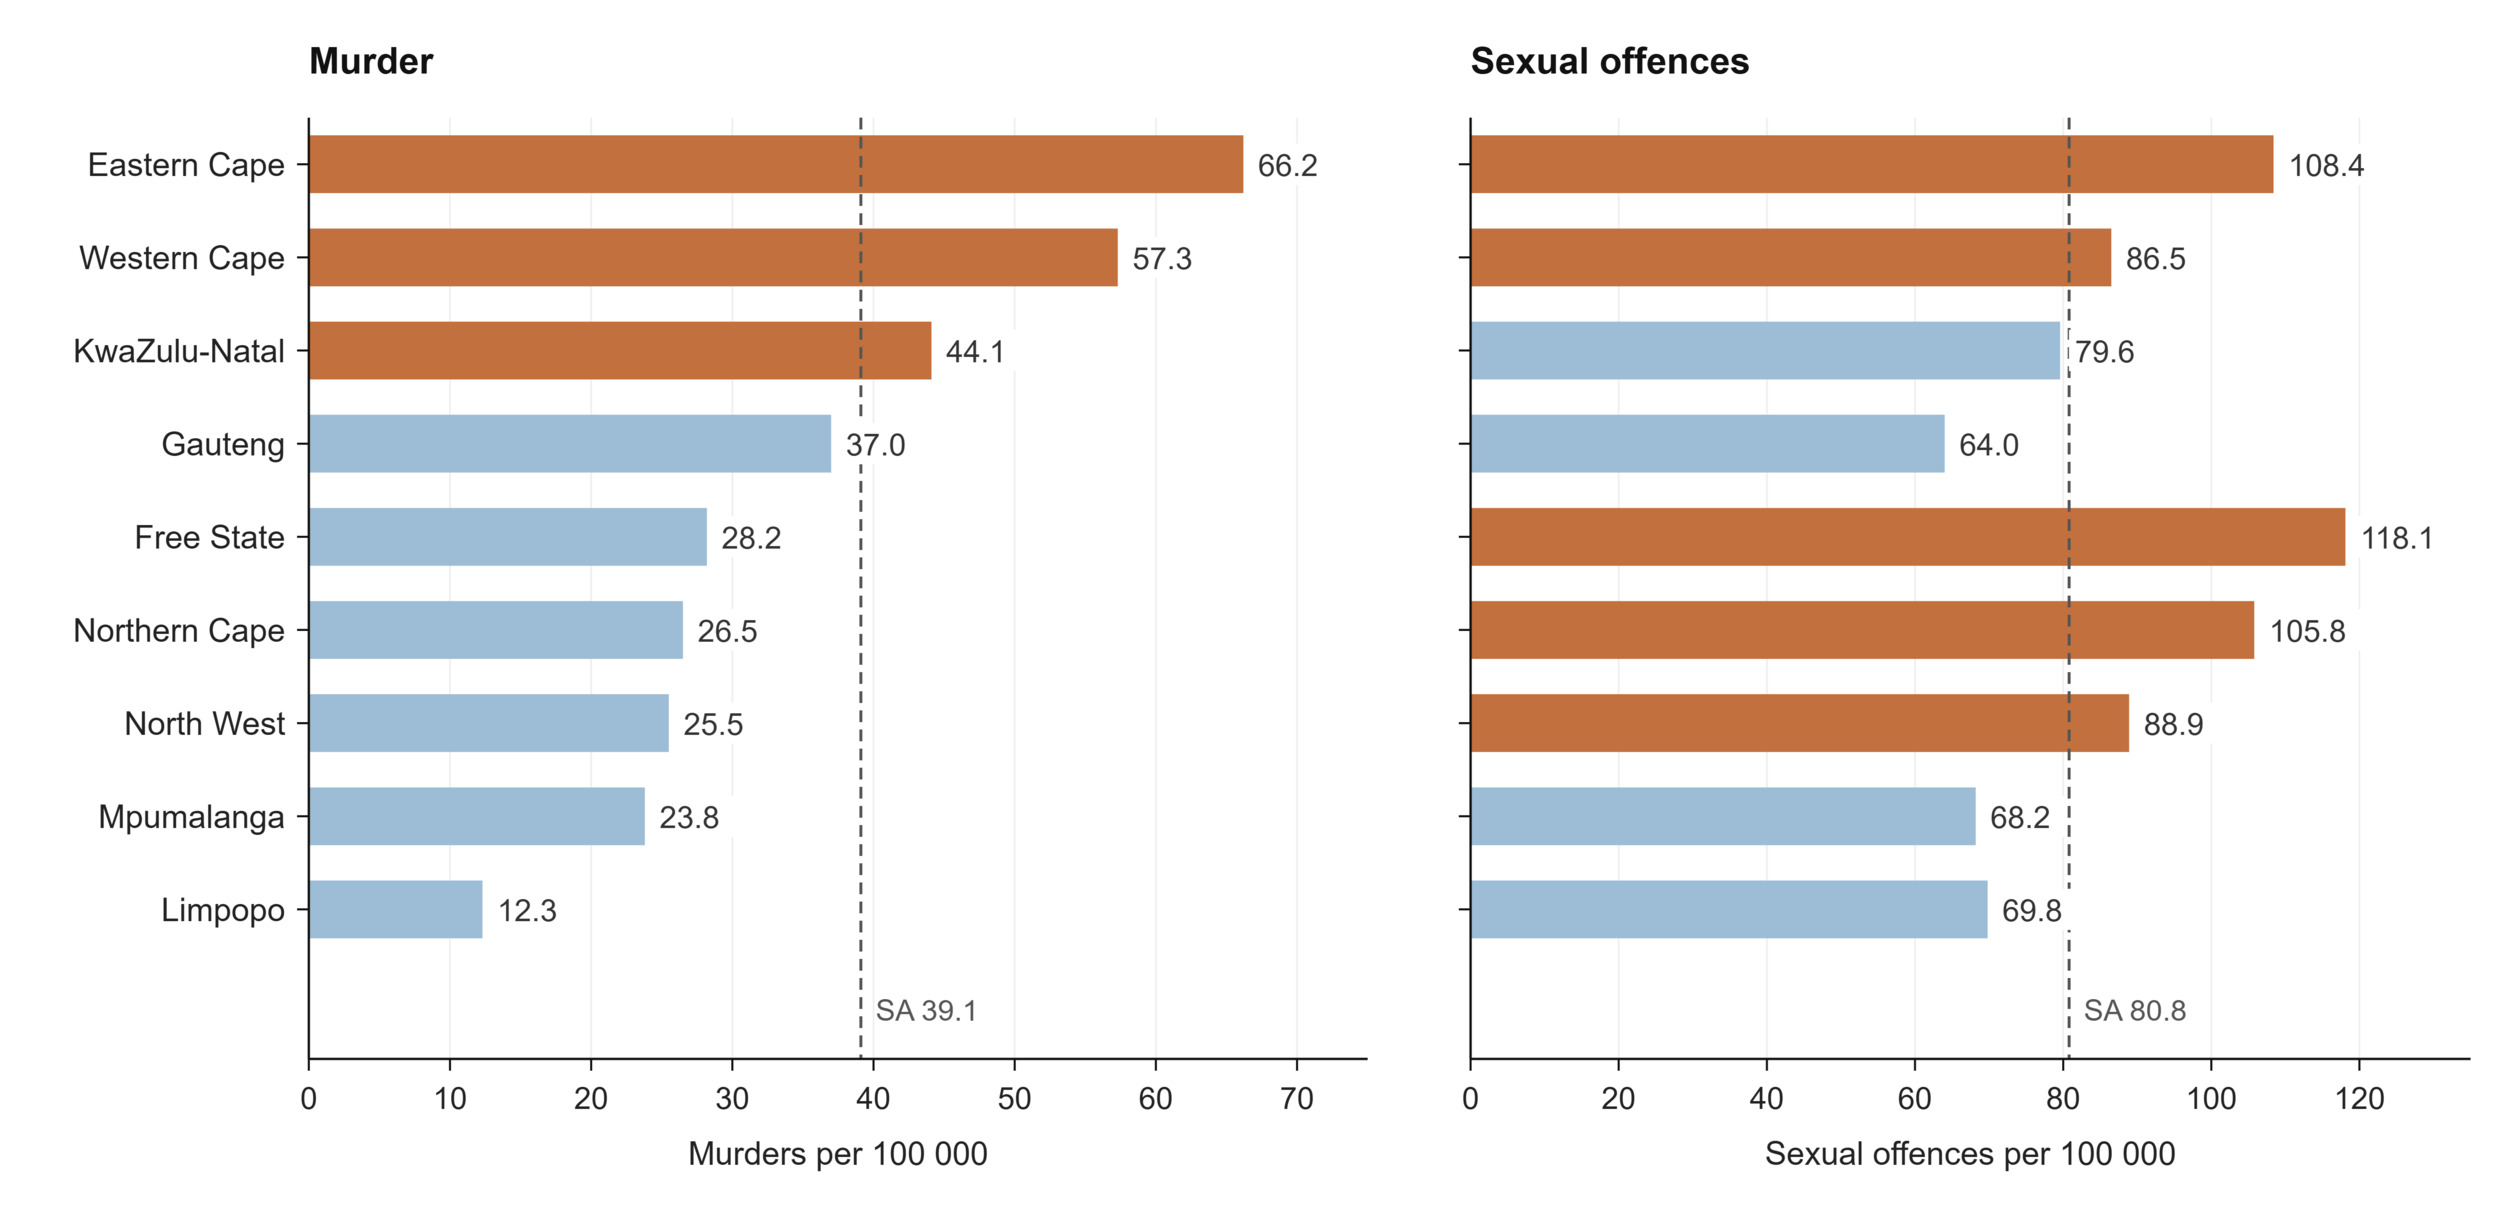
Figure 16.Recorded murder and sexual offences per 100 000 population by province, 2024/25
Source: SAPS, 202697; StatsSA, 20257
Intimate-partner violence compounds this picture. WHO estimates that 9.4% of ever-partnered women and girls aged 15 and older experienced physical or sexual violence from a partner in the previous year.54
Road traffic injury is a further major cause of preventable death. The Road Traffic Management Corporation (RTMC) recorded 11 485 road fatalities in 2025, a rate of 18.2 per 100 000 population, with the largest absolute tolls in Gauteng (2 296) and KwaZulu-Natal (2 110).100 Within the health system, the public sector trauma case rate stood at 6.8 per 1 000 population in 2024/25, highest in the Eastern Cape (10.1) and Limpopo (8.0), and the child and adolescent attempted suicide rate was 28.1 per 100 000, highest in the Eastern Cape (34.4) and Mpumalanga (31.3). These health system measures capture only those injuries and self-harm episodes that reach a facility and so understate the true community burden.32
Behavioural risk factors underlie much of this injury burden and the NCD burden described earlier. Alcohol is the common thread where total alcohol consumption averaged 8.6 litres of pure alcohol per adult per year, and among those consuming, intake is high by international standards and closely linked to trauma, road death and interpersonal violence.54,96 Data from the South African Community Epidemiology Network on Drug Use (SACENDU) sentinel surveillance network shows alcohol and cannabis to be the most common primary substances among people admitted for treatment, with methamphetamine prominent in the Western Cape (34% of admissions), and heroin more common in Gauteng but also common in the Western Cape. SACENDU reports only on people admitted to participating treatment facilities, so it describes the treated population rather than drug use in the general population, and is weighted towards the substances most likely to lead to a treatment admission, particularly low-grade heroin and methamphetamine, rather than cannabis.101 Among treatment admissions under 19 years, cannabis dominates as the primary substance across all reporting sites. Tobacco use remains substantial, with adult smoking prevalence estimated at 19.5% and age-standardised tobacco use at 23.7%.54,102 The Global Report on Homicides underscores that violence prevention must be evidence-based, differentiated by administrative level and tailored to local patterns of homicide, including neighbourhood-level programmes in areas with high concentrations of lethal violence. It also cautions that the intervention required depends on the type of homicide: preventing violence against women and girls, including gender-related killings, requires a different package of action from efforts to reduce organised-crime and gang violence. Some measures are system-wide, such as alcohol restrictions and stronger firearm controls, while others are targeted, including vocational support for young men at high risk of involvement in violence. The report further highlights the role of mental health, substance use, social disadvantage and access to weapons in interpersonal homicide, pointing to prevention strategies that improve the circumstances of disadvantaged patients, treat substance abuse and reduce weapon availability.96 These behavioural risks are modifiable, and each represents a point at which policy, if it could be monitored effectively, could interrupt the pathway to injury and chronic disease.
Learning signals: injuries, violence and risk behaviours
What does the data reveal? Despite improvements in certain indicators, injuries and risk behaviours continue to be a major cause of preventable mortality. Although progress has been made in reducing the number of road accident fatalities, the burden remains high and both substance and tobacco use continue to have a substantial impact.
Is the system responding? The evidence suggests that these indicators continue to be monitored against national targets and previous years’ trends, while policies and interventions continue to be informed by evidence and best practices. Although strategies are in place, their success depends on consistent implementation across sectors.
What prevents learning? To successfully address injury and risk behaviour requires action across multiple sectors. There is a need to strengthen and integrate routine data to monitor progress. The available data must also be utilised for informed policy decisions that will support continuous learning and effective implementation. |
Table 10.Injuries, violence and behavioural indicators
| Indicator |
Period |
SA |
EC |
FS |
GP |
KZ |
LP |
MP |
NC |
NW |
WC |
Road accident fatalities
both sexes RTMCa |
2025 |
11 485 |
1 313 |
696 |
2 296 |
2 110 |
1 381 |
1 212 |
335 |
862 |
1 280 |
Road accident fatalities per 100 000 population
both sexes RTMCa |
2025 |
18.2 |
18 |
|
|
|
|
|
|
|
|
Number of admissions for alcohol and other drug abuse
both sexes all ages SACENDUb |
Jan-Jun 2025 |
|
172 |
4 166 |
|
701 |
1 489 |
|
|
|
|
Prevalence of smoking
both sexes adult WHOc |
2023 |
19.5 |
|
|
|
|
|
|
|
|
|
|
both sexes adult age-standardized WHOd |
2024 |
23.7 |
|
|
|
|
|
|
|
|
|
Primary drug of abuse as % of all drugs of abuse
both sexes <19 years SACENDU alcoholb |
Jan-Jun 2025 |
|
2.0 |
|
5.5 |
23.2 |
|
|
|
|
10.3 |
| both sexes <19 years SACENDU cannabisb |
|
78 |
|
79.8 |
63.6 |
|
|
|
|
75.3 |
| both sexes <19 years SACENDU cocaineb |
|
4 |
|
0 |
0 |
|
|
|
|
0.4 |
| both sexes <19 years SACENDU heroinb |
|
0 |
|
0.1 |
1 |
|
|
|
|
0 |
| both sexes <19 years SACENDU mandraxb |
|
0 |
|
0.8 |
2 |
|
|
|
|
0.8 |
| both sexes <19 years SACENDU methamphethamineb |
|
16 |
|
2.4 |
1 |
|
|
|
|
5.3 |
| both sexes all ages SACENDU alcoholb |
|
14 |
|
19.2 |
36.3 |
|
|
|
|
21 |
| both sexes all ages SACENDU cannabisb |
|
29 |
|
41.4 |
35.7 |
|
|
|
|
21 |
| both sexes all ages SACENDU cocaineb |
|
6 |
|
1.4 |
5.8 |
|
|
|
|
5 |
| both sexes all ages SACENDU heroinb |
|
1 |
|
6.4 |
1.2 |
|
|
|
|
9 |
| both sexes all ages SACENDU mandraxb |
|
3 |
|
2.1 |
0 |
|
|
|
|
8 |
| both sexes all ages SACENDU methamphethamineb |
|
12 |
|
17.9 |
16.4 |
|
|
|
|
34 |
Total alcohol per capita (age 15+ years) consumption (litres per year)
both sexes WHOd |
2024 |
8.6 |
26 |
|
|
|
|
|
|
|
|
Proportion of ever-partnered women and girls aged
15 years and older subjected to physical and/or sexual violence by a current or former intimate partner in the previous 12 months (%)
WHOd |
2023 |
9.4 |
|
|
|
|
|
|
|
|
|
Homicides (per 100 000 population)
both sexes SAPS Police-recordede |
2024/25 |
39.1 |
66.2 |
28.2 |
37 |
44.1 |
12.3 |
23.8 |
26.5 |
25.5 |
57.3 |
| both sexes Global Reportf |
2021 |
5.8 |
|
|
|
|
|
|
|
|
|
| male Global Reportf |
|
9.3 |
|
|
|
|
|
|
|
|
|
| female Global Reportf |
|
2.2 |
|
|
|
|
|
|
|
|
|
Sexual offences rate (per 100 000 population)
both sexes SAPS Police-recordede |
2024/25 |
80.8 |
108.4 |
118.1 |
64 |
79.6 |
69.8 |
68.2 |
105.8 |
88.9 |
86.5 |
Trauma case rate
both sexes DHIS public sectorg |
2024/25 |
6.8 |
10.1 |
4.7 |
6.8 |
6.3 |
8 |
7 |
3.9 |
7.6 |
6 |
Child and adolescent attempted suicide rate
both sexes DHISg |
2024/25 |
28.1 |
34.4 |
25.3 |
28 |
24.4 |
28.6 |
31.3 |
26.4 |
23 |
22.6 |
REFERENCE NOTES
a RTMC 2025
b SACENDU Brief Jan-Jun 2025
c WHO Global Tabacco 2025
d World Health Statistics 2026
e SAPS 2024/25
f Global Report on Homicides 2023
g DHIS
DEFINITIONS
Child and adolescent attempted suicide rate [per 100 000 population] — Children and adolescents treated at a health facility following a suicide attempt, per 100 000 of the uninsured population in that age group.
Homicides (per 100 000 population) [Percentage] — Number of murders recorded by the South African Police Service during the reporting year, divided by the mid-year population estimate and multiplied by 100 000.
Number of admissions for alcohol and other drug abuse [Number] — Number of patients admitted for treatment by treatment centres who are part of the SACENDU Project sentinel surveillance system.
Prevalence of smoking [Percentage] — Proportion of population who currently smoke. This indicator is also known as ‘Current smokers (%)’. Note that the indicator may be given just for cigarettes or for other tobacco products. The WHO Core indicator is ‘Age-standardized prevalence of current tobacco use among persons aged 18+ years’ and is defined as: Age-standardized prevalence of current tobacco use among persons aged 18+ years.
Primary drug of abuse as % of all drugs of abuse [Percentage] — Percentage breakdown of the primary drug of abuse reported by patients admitted to treatment centres that are part of the SACENDU sentinel surveillance system.
Proportion of ever-partnered women and girls aged 15 years and older subjected to physical and/or sexual violence by a current or former intimate partner in the previous 12 months [Percentage] — The percentage of ever-partnered women and girls aged 15 years and older who experienced physical and/or sexual violence by a current or former intimate partner in the previous 12 months. Sustainable Development Goal indicator 5.2.1.
Road accident fatalities [Number] — Number of people killed during or immediately after a crash, or who died within 30 days of a crash as a direct result of it.
Road accident fatalities per 100 000 population [per 100 000 population] — Number of fatalities due to road accidents per 100 000 population.
Sexual offences rate (per 100 000 population) [per 100 000 population] — Sexual offences recorded by the South African Police Service per 100 000 population. Recorded offences reflect reporting to the police rather than the underlying prevalence of sexual violence.
Total alcohol per capita (age 15+ years) consumption (litres per year) [litres per person] — Total alcohol per capita is the total amount (sum of recorded alcohol per capita three-year average and unrecorded alcohol per capita) of alcohol consumed per adult (15+ years) in a calendar year, in litres of pure alcohol. Recorded alcohol consumption refers to official statistics (production, import, export, and sales or taxation data), while unrecorded alcohol consumption refers to alcohol which is not taxed and is outside the usual system of government control. In circumstances in which the number of tourists per year is at least the number of inhabitants, tourist consumption is also taken into account and is deducted from a country’s recorded alcohol per capita.
Trauma case rate [per 1 000 population] — Trauma cases seen at a health facility per 1 000 of the uninsured population.
Mortality
Mortality is the ultimate outcome against which the health system is measured, and South Africa’s vital registration system provides a more complete and more finely coded record of it than is available in most countries in the region, with cause of death coded to ICD-10 for registered deaths (Table 11). A total of 476 751 deaths were registered for 2023, the most recent year for which cause-of-death data is available.103 Life expectancy at birth reflects the substantial recovery achieved since the height of the HIV epidemic and the COVID-19 pandemic, estimated at 66.9 years overall, 69.6 for females and 64.0 for males on the Stats SA mid-year series.7 The GBD study places these figures slightly lower, at 69.3 for females and 62.9 for males, a divergence consistent with the source differences discussed elsewhere in this paper and one that widens for men.68 The persistent gap of more than five years between female and male life expectancy is an important mortality signal. South African mortality analyses show substantially higher male mortality from injuries and tuberculosis, alongside sex differences in several non-communicable causes, all of which are likely to contribute to the gap.104,105
Table 11.Mortality indicators
| Indicator |
Period |
SA |
EC |
FS |
GP |
KZ |
LP |
MP |
NC |
NW |
WC |
Life expectancy at birth
both sexes mid-yeara |
2025 |
66.9 |
|
|
|
|
|
|
|
|
|
| female mid-yeara |
69.6 |
|
|
|
|
|
|
|
|
|
| male mid-yeara |
64.0 |
|
|
|
|
|
|
|
|
|
| female GBDb |
69.3 |
|
|
|
|
|
|
|
|
|
| male GBDb |
62.9 |
|
|
|
|
|
|
|
|
|
REFERENCE NOTES
a Stats SA MYE 2025
b GBD 2023
DEFINITIONS
Life expectancy at birth [Years] — The average number of additional years a person could expect to live if current mortality trends were to continue for the rest of that person’s life.
The causes of death confirm that South Africa is well into its epidemiological transition, though it carries the burdens of that transition unevenly. Non-communicable diseases occupied the top three positions in 2023: diabetes mellitus was the single leading underlying cause of death at 5.8% of all deaths, followed by cerebrovascular disease (5.4%) and hypertensive disease (5.2%).103 This ranking marks a decisive shift from two decades ago, when communicable diseases dominated, and it aligns with the GBD finding that NCD mortality is rising across sub-Saharan Africa while the mean age at death from these conditions remains lower than in higher-income settings.106 COVID-19, which featured among the leading causes in 2020 and 2021, fell out of the top ten in 2023, and age-specific death rates confirm the scale of that shock and its passing: among adults aged 80 and older, the death rate rose from about 120 per 1 000 in 2019 to 159 in 2021 before falling back to 114 in 2023, and the same peak-and-recovery pattern is visible at every adult age (Figure 17).103
Beneath the national ranking, mortality is strongly patterned by sex and age (Figure 17). The leading causes diverge markedly between men and women. Tuberculosis was the leading single cause of death among men, accounting for 5.1% of male deaths, followed by cerebrovascular disease (4.4%) and diabetes (4.3%), and HIV disease ranked fifth at 3.8%. Among women, diabetes led at 7.5% of female deaths, followed by hypertensive disease (6.8%) and cerebrovascular disease (6.5%), with TB far lower at 3.2%. Non-natural causes accounted for 19.6% of male deaths but only 5.9% of female deaths, the single starkest sex difference in the mortality data and the demographic signature of the injury burden described in the preceding section.103 The leading cause of death also shifts systematically across the life course: perinatal respiratory and cardiovascular disorders led in infancy (15.9% of infant deaths); influenza and pneumonia among children aged 1 to 14 (6.0%); HIV and TB together among those aged 15 to 44 (8.3%); diabetes among adults aged 45 to 64 (7.0%); and hypertensive disease among those aged 65 and older (9.2%).103 This progression is the epidemiological transition rendered as a single life course, from infectious and perinatal causes at the beginning of life to chronic disease at its end.
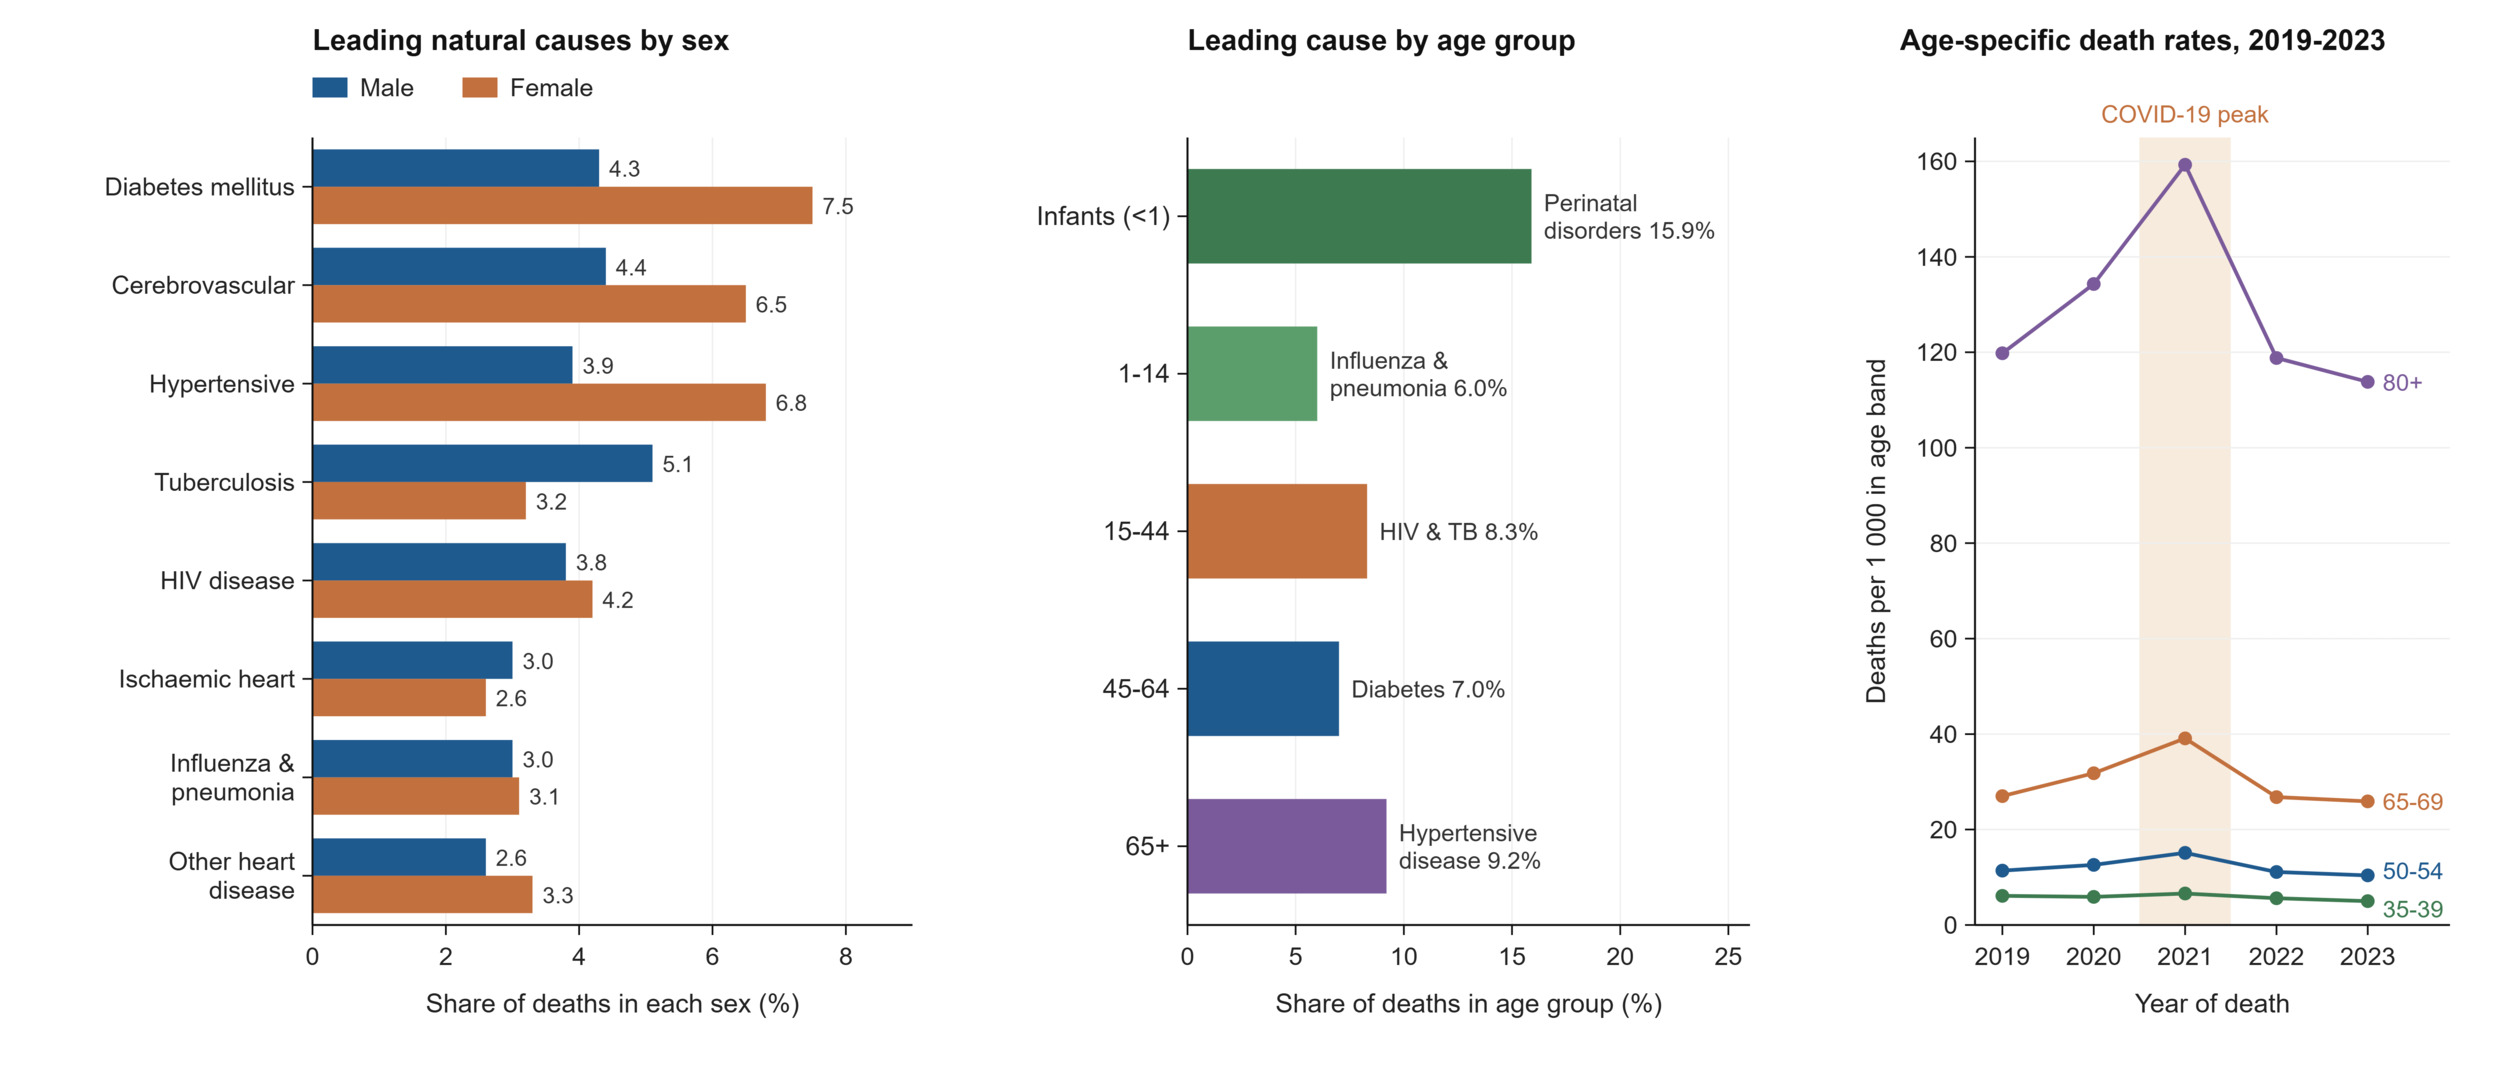
Figure 17.Leading natural causes of death by sex, leading underlying cause of death by age group, and age-specific death rates showing the COVID-19 mortality shock, 2019–2023
Source: Stats SA, 2025.103
The geography of death adds a further dimension that connects this section to the rest of the paper. Gauteng recorded the highest share of deaths (21.2%), followed by KwaZulu-Natal (18.3%) and the Eastern Cape (16.4%), while the Northern Cape recorded the lowest (3.2%), a distribution shaped by population size and by movement toward urban centres for care as much as by mortality risk itself. Place of death is informative in its own right as it shows that 38.7% of deaths occurred in hospital and 24.4% at home, a split that speaks to access to end-of-life and emergency care. Non-natural deaths were most concentrated in KwaZulu-Natal (15.7% of that province’s deaths) and Gauteng (14.4%). Within non-natural causes, the Northern Cape recorded the highest proportions of deaths from assault (15.4%) and transport accidents (24.7%), echoing the injury geography described earlier and underlining that mortality data is where the separate threads of this paper finally converge. Deaths occurring outside health facilities also create challenges for cause-of-death certification because certifiers may have limited access to the deceased person’s medical history.103,107
A final view reframes these deaths not by what people died of but by what put them at risk. The GBD study106 attributes mortality to underlying behavioural, metabolic and environmental risk factors, and its ranking for South Africa reads almost as a summary of this paper (Figure 18). Unsafe sex, the pathway for HIV, is the single largest attributed risk, followed by the cardiometabolic cluster of high blood pressure, high blood sugar and obesity that drives the leading registered causes of death, then air pollution and the behavioural risks of smoking and alcohol, and further down the early-life risks of low birthweight and child undernutrition.106 Each maps back to a domain examined earlier, from the socio-economic and environmental section through nutrition, NCDs and injury. Two things to note with this figure, however, is that it is a modelled, counterfactual attribution rather than a count: a single death can be attributed to several risks at once, which is why the attributed totals sum to far more than the number of people who die, and why unsafe sex alone exceeds many whole cause categories. And it is an imported estimation, produced internationally rather than domestically, with wide uncertainty that the modellers themselves flag for countries with weaker vital registration. The registered causes and the modelled risks are two instruments trained on the same reality, and the paper is strongest when they are read together and knowingly: the first tells the health system what is killing its people, the second suggests where prevention might intervene, and neither on its own is sufficient to close the loop.92
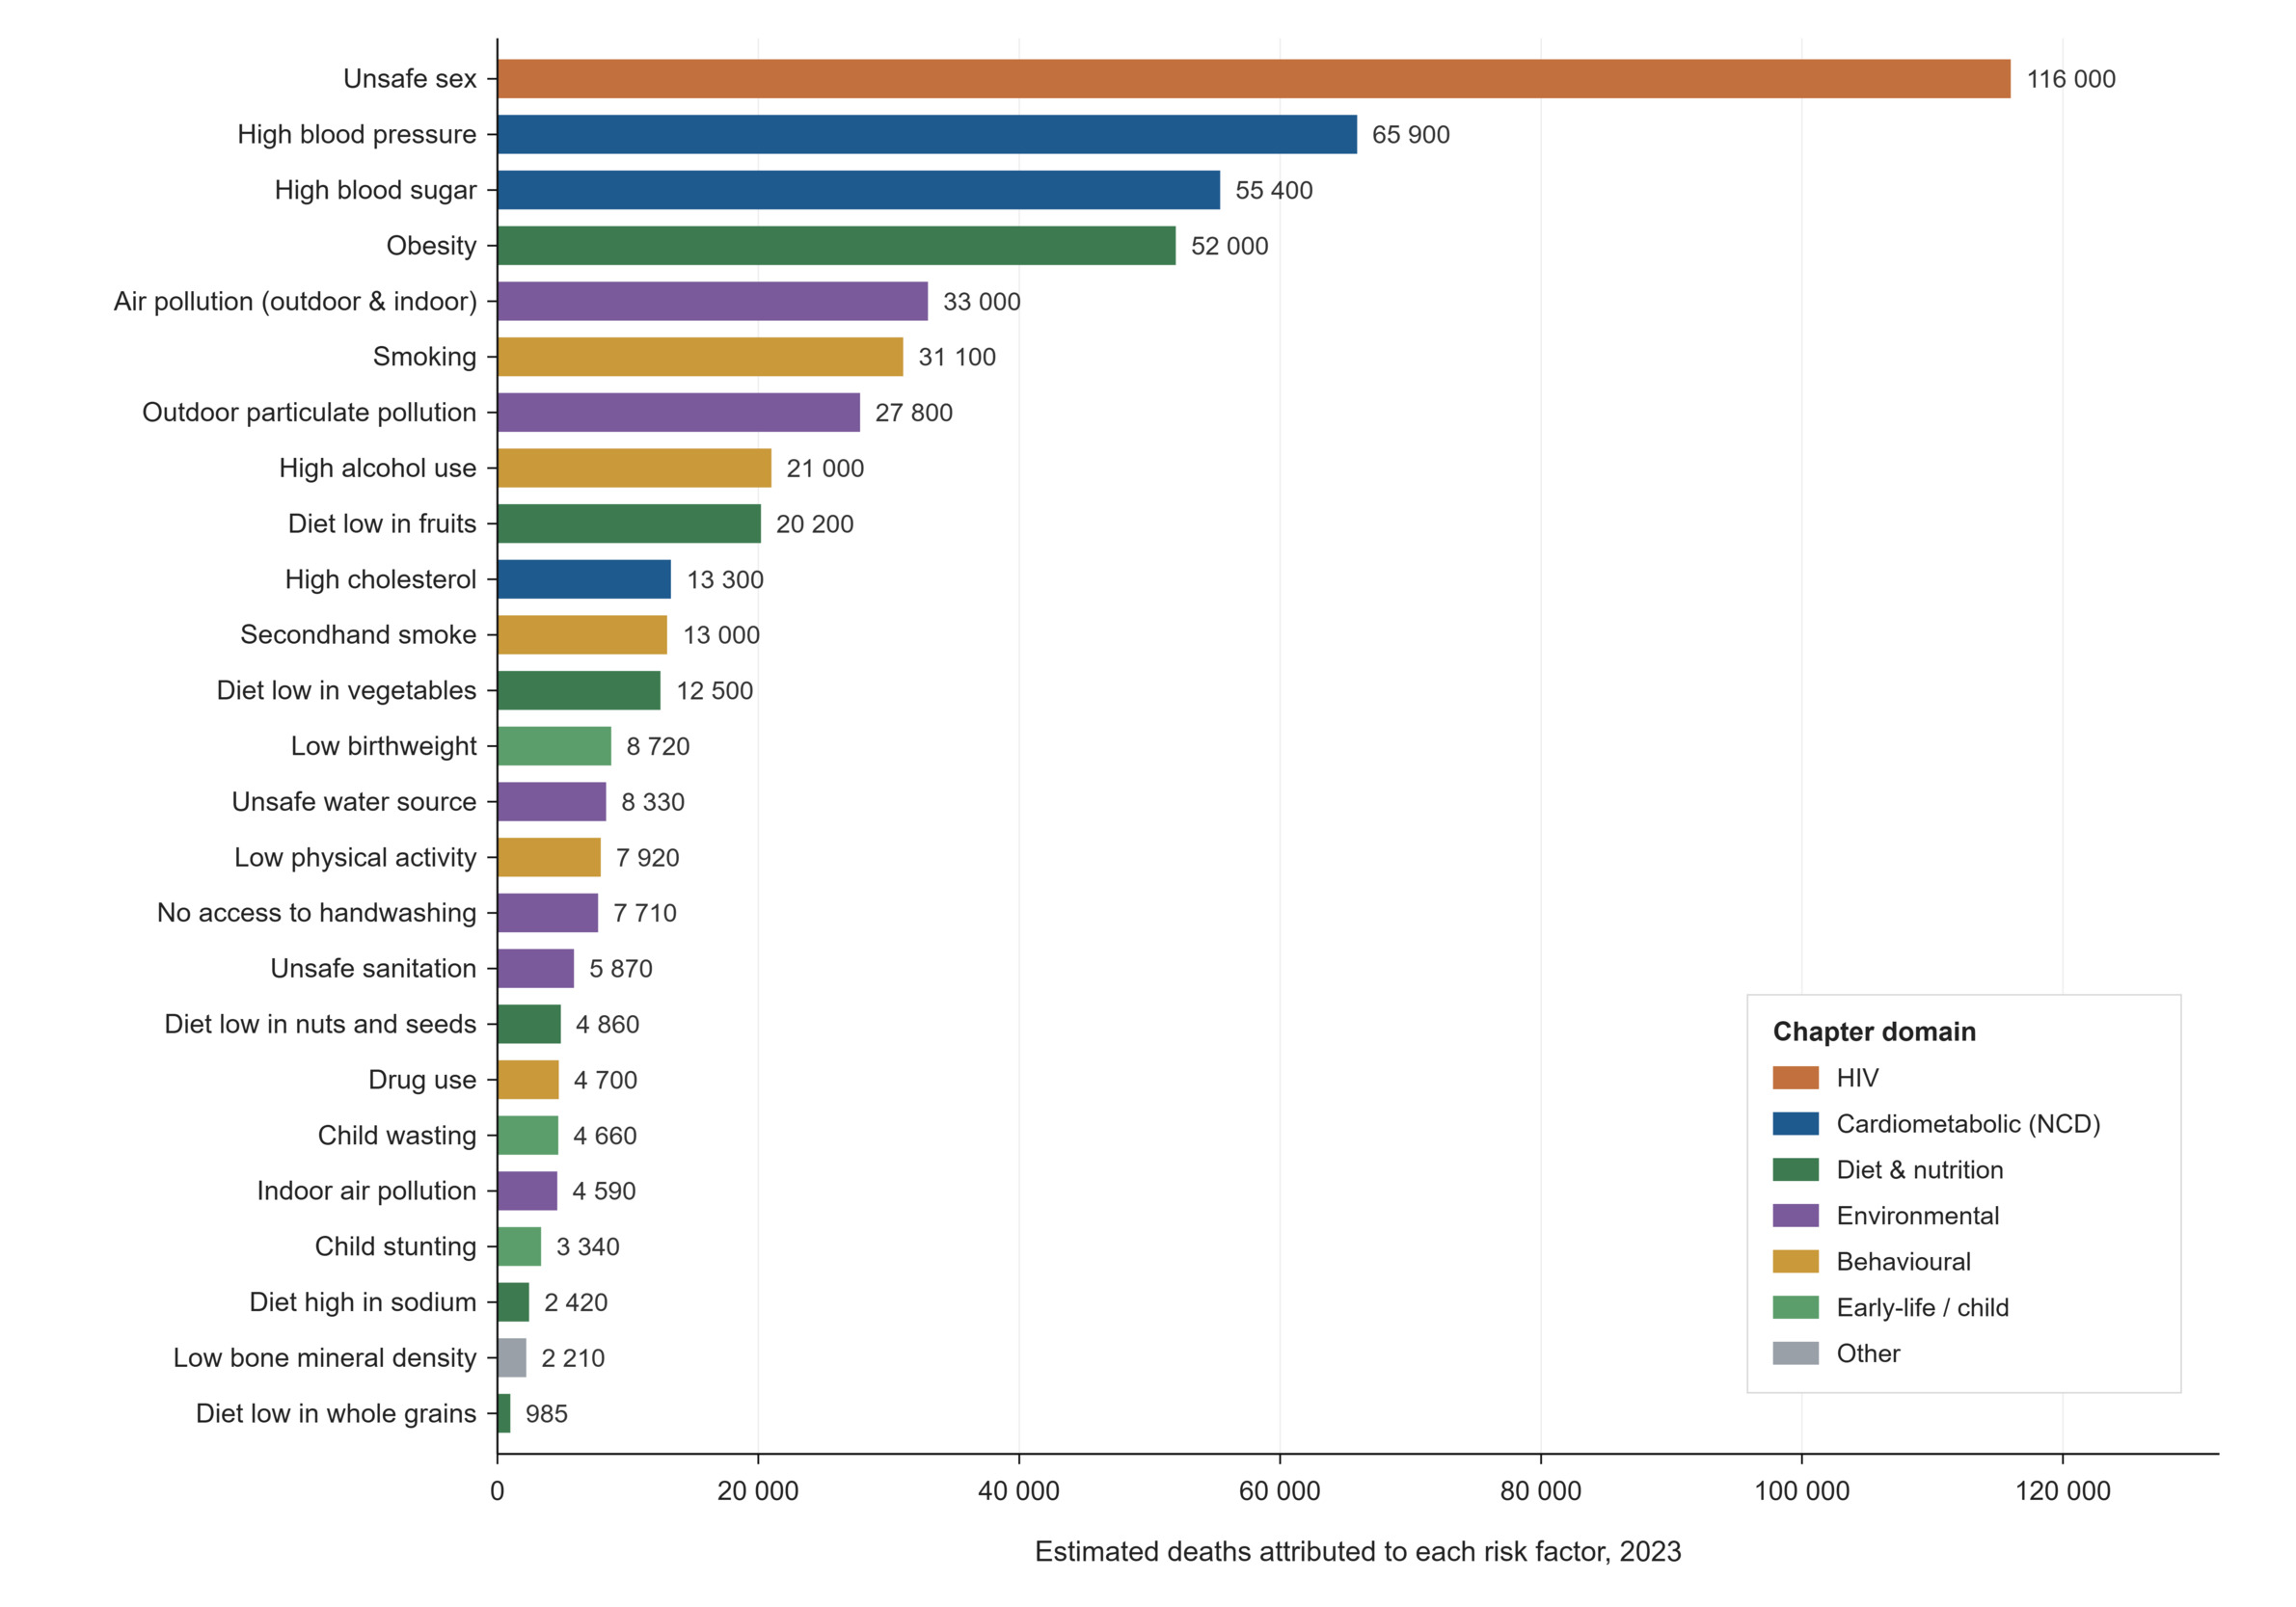
Figure 18.Deaths attributed to risk factors, South Africa, 2023
Learning signals: mortality
What does the data reveal? Mortality data pulls the whole paper together, because it records where the health system's successes and failures ultimately register. The leading causes confirm the epidemiological transition: NCDs now head the list, with diabetes the single leading cause of death, yet the picture is sharply patterned by sex and age. TB remains the leading cause among men while diabetes leads among women, and the leading cause shifts across the life course, from perinatal conditions in infancy, through HIV and TB in early adulthood, to diabetes and then hypertensive disease in older age. Place of death is its own signal: fewer than four in ten deaths occur in hospital and roughly a quarter occur at home, and the province with the highest share of violent deaths, KZ, connects this section directly to the injuries data.
Is the system responding? South Africa's civil registration and vital statistics system is one of the strongest in the region, with death registration completeness estimated at around 94%, and the annual causes-of-death release provides a consistent, long-running series that few comparable countries can match.108 This is a functioning information asset, and modelled sources such as THEMBISA use it, alongside antenatal and programme data, to reconstruct HIV-related mortality trends that the raw cause coding understates.9 The weak link is the timeliness of detailed cause-of-death information. South Africa does have a rapid mortality-surveillance system: the SAMRC publishes monthly reports of estimated weekly deaths using the National Population Register, enabling near-real-time monitoring of all-cause and broad natural and non-natural mortality. However, this rapid series does not provide the detailed underlying-cause profiles required to monitor specific diseases. The detailed Stats SA report, therefore, remains subject to a substantial publication lag.
What prevents learning? Two limitations shape how this data can be read. National completeness conceals historically important subnational variation. A Stats SA analysis of the 2011–2016 intercensal period estimated lower adult death-reporting completeness in EC, MP and LP than in NC, GP and WC. Because these estimates relate to an earlier period and are sensitive to migration and demographic-method assumptions, they should be treated as evidence of geographic variation rather than as current provincial completeness rates. Cause-of-death coding is the deeper issue: a substantial share of deaths is assigned to ill-defined causes, and deaths in people living with HIV are frequently coded to an immediate cause such as TB or pneumonia rather than to HIV, so the cause rankings understate HIV and overstate its opportunistic infections.109 The prominence of diabetes at the top of the list is real but must be read in this light. The alternative of turning to international estimates offers little relief on timeliness: the WHO Global Health Estimates for leading causes of death still reported 2021 as their most recent year at the time of writing, older than South Africa’s own registration data, so the domestic vital statistics system, for all its coding limitations, remains the more current source. As throughout the paper, the data are a strong asset whose limits are documented; the learning risk lies in using the rankings at face value without carrying those caveats into interpretation. |
Health service indicators
Health facilities
Where earlier sections describe the diseases the health system confronts, this one describes the system itself: the facilities, beds and contacts through which care is delivered. The public sector operated 85 127 inpatient beds in March 2025, a national ratio of 16 beds per 10 000 uninsured population, alongside 3 155 fixed clinics, 344 community health centres, and a hospital platform running from 253 district hospitals up to nine national central hospitals. Through this network passed just over 105 million PHC contacts in 2024/25, including 16.7 million by children under five. Despite that volume, the primary care utilisation rate averaged 1.7 visits per person per year, rising to 2.8 among under-fives, figures that indicate a system carrying a heavy absolute load at a modest per-capita intensity of use (Table 12).32 It is expected for PHC utilisation rates to be high among children due to routine immunisation schedules, growth monitoring, nutrition services, and management of common childhood illnesses. In the private sector, the average number of General Practitioner (GP) visits was 3.29 in 2024 with the average claimed per visit at R561.70.13
Bed supply and bed use tell two different stories, and the gap between them is instructive (Figure 19). The national inpatient bed utilisation rate was 66% in 2024/25, ranging from 85.5% in the Western Cape and 78.2% in Gauteng, down to the high 50s and low 60s in the Eastern Cape, Free State and Northern Cape. The pattern is one of supply and use pulling apart.32 The Western Cape and North West sustain high occupancy on moderate bed supply. High occupancy is not by itself evidence of efficiency, it may reflect a well-managed inpatient platform, but equally insufficient capacity, delayed discharge, or sustained system pressure, and these cannot be distinguished from utilisation data alone. Meanwhile, the Eastern Cape holds the most beds per head (20.4 per 10 000) but only middling occupancy, illustrating that capacity and its effective use are separate things. When considered alongside the average length of stay (ALOS) findings, low bed utilisation rates coupled with longer inpatient stays may indicate low patient turnover, prolonged admissions, inefficiencies in patient flow, or delays in discharge processes. As a result, admitted patients occupy hospital beds for longer periods, reducing bed availability for new admissions and potentially affecting the efficiency of hospital service delivery.110
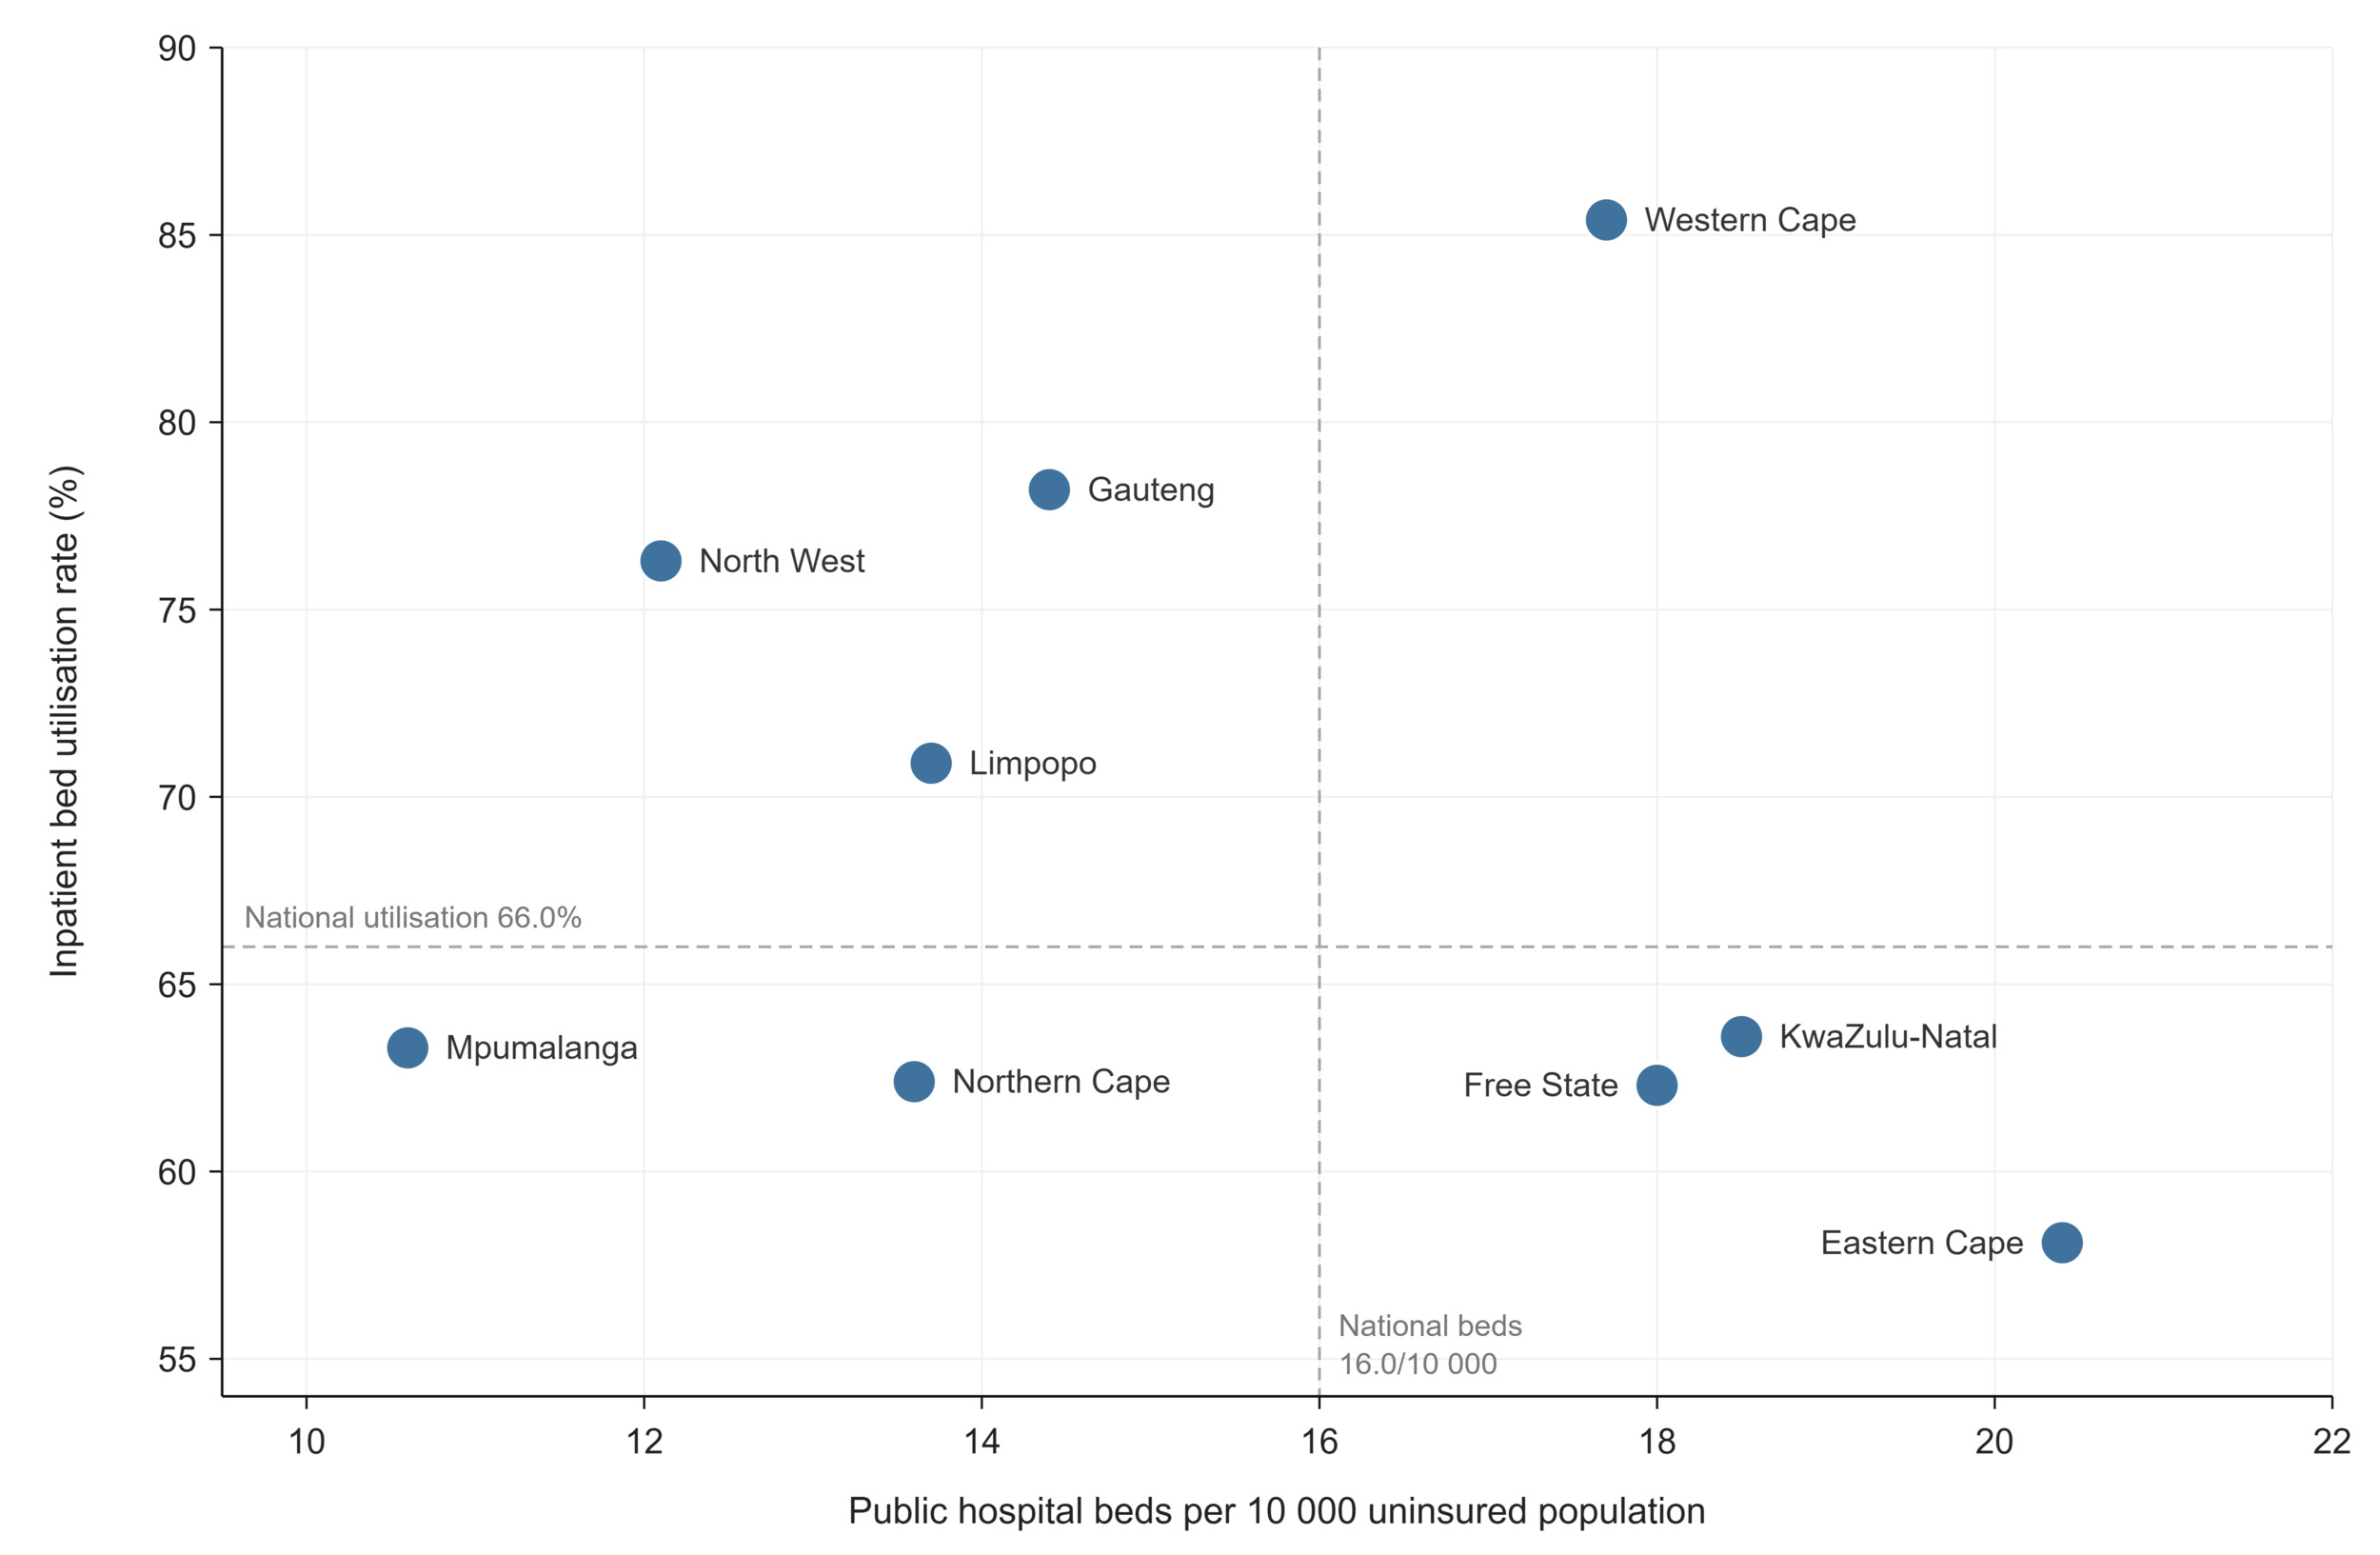
Figure 19.Public hospital bed (per 10 000 uninsured population) versus inpatient bed utilisation rate by province, 2024/25
The national inpatient crude death rate was 4.7% in the public sector. The Eastern Cape recorded the highest inpatient crude death rate at 6.1%, followed by Gauteng (5.2%) and Northern Cape (5.1%), all of which exceeded the national average. In contrast, the Western Cape recorded the lowest inpatient crude death rate at 3.4%, followed by the Free State (4.1%) and Mpumalanga (4.5%). Provinces such as Gauteng and KwaZulu-Natal, that host the majority of central hospitals often manage a greater proportion of disease burden, which may contribute to higher crude death rates. When considering other hospital performance factors such as ALOS, bed utilisation and the level of care provided, Gauteng and KwaZulu-Natal recorded the largest number of inpatient deaths, reflecting not only their large population sizes but also admission volumes and specialised referral services. However, the Eastern Cape’s high crude death rate, coupled with lower bed utilisation and ALOS warrant further investigation to understand patient flow, disease burden, access to specialised care, and service delivery within the province’s health facilities.32,111
Indicators of how patients move through the system, and of how well it responds to them, vary far more than the facility counts do. The proportion of new outpatient clients not referred from a lower level, a measure of whether people enter care at the appropriate level, ranged extraordinarily widely, from 10.5% in the Western Cape to 61.9% in the Northern Cape and 59.7% in Limpopo.32 This partly reflects genuine patient behaviour where South African studies document widespread bypassing of primary care, with patients self-referring directly to hospitals because of perceptions of poor clinic quality, long waiting times, and medicine stock-outs. The General Household Survey points the other way at population level, with most households reporting a clinic or community health centre, rather than a hospital, as the facility they would normally use first when ill. The two sources measure different things: the survey records a stated first choice, while the DHIS indicator records where unreferred patients actually presented.112 Complaint-management performance appears administratively strong, with more than 90% of recorded complaints resolved in most provinces. However, the indicator does not show the nature or seriousness of the complaints, whether complainants regarded the response as satisfactory, or whether recurrent service problems were corrected.113
The Ideal Clinic programme represents an LHS innovation that seeks to improve the quality, efficiency and responsiveness of PHC services through continuous performance monitoring and data-driven decision making.80 In support of this objective, Ideal Clinics are expected to maintain adequate staff, continuous availability of medicine and supplies, and provide high-quality patient care. As shown in Table 12, 80% of South African clinics were classified as Ideal Clinics, although provincial variation was observed. For example, the Northern Cape recorded the lowest proportion of Ideal Clinics (40%), indicating that many PHC facilities in the province have not yet met the composite standard. The aggregate percentage cannot show which components of the framework, spanning infrastructure, staffing, medicine availability, administrative processes and clinic governance, account for the shortfall; component-level assessment results would be required to establish that and to target support accordingly. To support an LHS, these findings present opportunities for targeted interventions to improve quality of care, to strengthen knowledge-sharing and continuously use routine health information to guide facility performance.80
The registration and preparedness indicators round out the system’s administrative backbone. Birth registration within 30 days reached 83.2% in 2024, while death registration completeness stood at around 94%, among the strongest civil registration performance in the region and the foundation on which the mortality section rests.10,103 South Africa’s International Health Regulations core capacity index, a WHO measure of preparedness for public health emergencies across thirteen domains, stood at 63% in 2025.54 The private hospital sector, by contrast, surfaces only in fragments: medical schemes report an average length of stay of 3.9 days in general wards, 6.0 in intensive care and 11.5 in mental health facilities, but publish none of the bed supply, utilisation, or referral measures that would allow a genuine comparison with the public platform described here, leaving the two-systems measurement gap that recurs throughout this paper unresolved in the one domain, service delivery, where both sectors are most active (Table 12).13
Learning signals: health facilities
What does the data reveal? This is the domain where the health system observes itself, and it does so in more detail and more currently than anywhere else in the paper. Primary care carries an enormous load, more than 105 million contacts in a year, yet utilisation averages under two visits per person and beds are used unevenly, from around 85% occupancy in WC to the high 50s and low 60s in several provinces. The indicators that describe how patients move through the system, referral behaviour, complaint resolution and Ideal Clinic status, vary far more among provinces than the underlying facility counts do, which points less to differences in infrastructure than to differences in how services are organised and, crucially, in how consistently the data are defined and captured.
Is the system responding? Service delivery has some of the health system’s most developed routine monitoring infrastructure. DHIS generates frequent facility-level information, while the Ideal Clinic programme links assessment results to defined standards and improvement actions. These systems create the potential for an active learning cycle, but data production and standards assessment do not guarantee learning. Recent South African analyses have identified limited integration, delayed production of usable information, and weak alignment with district managers’ decision-making needs. Experience with the Ideal Clinic programme further shows that assessments support learning most effectively when results are collectively interpreted and used to diagnose and address underlying service problems, rather than treated primarily as compliance targets.114–116 The open question is depth rather than existence. High-level indicators such as bed utilisation or the not-referred rate flag that something differs between provinces, but rarely explain why, and the leap from noticing an outlier to diagnosing and correcting it still depends on local investigation that the routine data can prompt but not perform.
What prevents learning? The paradox of this domain is that its richness is also its weakness: because service data is generated by the act of delivering care, it measures activity reliably but says little on its own about outcome or need. A high primary-care headcount cannot distinguish thorough care from repeat visits for unresolved problems, and utilisation rates rest on the same uninsured-population denominators, rebased this year, that unsettle every ratio in this paper. Data quality is the sharper issue, in two forms. Miscaptured values can distort a whole province: FS’s apparent bed utilisation was pulled far below its true level of around 62% by one private facility recorded with an impossible bed count, a reminder that a single bad figure can masquerade as a performance story. The anomaly was identified through the plausibility screening described in the Method section (the recorded bed count was incompatible with the facility’s size and with the province’s 2023/24 series), and the corrected figure is used throughout this paper. The facility appears in the extract because selected private facilities report into DHIS, a reminder that public sector analyses require careful facility-level classification. And confirmed real signals still carry a definitional component: the OPD not-referred rate, from about 10% in WC to 62% in NC, reflects genuine bypassing of primary care documented in the South African literature, but its extreme spread also exposes differences in how facilities interpret and record the indicator, so the system must separate the behaviour it is seeing from the artefact of how it is measured. The private hospital sector reports only fragments, such as length of stay by ward type, with no comparable public units, so the two-systems measurement gap seen throughout the paper persists here too. The learning risk is characteristic of mature information systems: the abundance of activity data can crowd out the harder questions of whether that activity is reaching the right people and improving their health. |
Table 12.Health services indicators
| Indicator |
Period |
SA |
EC |
FS |
GP |
KZ |
LP |
MP |
NC |
NW |
WC |
Average length of stay - total
DHISa |
2024/25 |
6.4 |
7 |
6 |
7.4 |
6.9 |
5.7 |
4.7 |
5.6 |
6.6 |
5.6 |
| Med Schemes General wardb |
2024 |
3.9 |
|
|
|
|
|
|
|
|
|
| Med Schemes High Careb |
4.2 |
|
|
|
|
|
|
|
|
|
| Med Schemes ICUb |
6 |
|
|
|
|
|
|
|
|
|
| Med Schemes Mental Health Institutionsb |
11.5 |
|
|
|
|
|
|
|
|
|
Birth registration coverage
both sexes live births 0-30 daysc |
2024 |
83.2 |
|
|
|
|
|
|
|
|
|
Death registration coverage
vital registrationd |
2023 |
94 |
|
|
|
|
|
|
|
|
|
Complaint resolution rate
DHISa |
2024/25 |
92.6 |
91.7 |
91.3 |
92.5 |
94.5 |
91 |
90.6 |
68.9 |
96.9 |
|
International Health Regulations (IHR) core capacity index
WHOe |
2025 |
63 |
|
|
|
|
|
|
|
|
|
Number of beds
DHIS public sectora |
Mar 2025 |
85 127 |
13 111 |
4 822 |
17 873 |
20 514 |
7 853 |
4 721 |
1 636 |
4 480 |
10 117 |
Hospital beds per 10 000 target population
DHIS Public Sectora |
March 2025 |
16 |
20.4 |
18 |
14.4 |
18.5 |
13.7 |
10.6 |
13.6 |
12.1 |
17.7 |
Inpatient bed utilisation rate - total
DHISa |
2024/25 |
66 |
58.2 |
35.3 |
78.2 |
63.7 |
70.9 |
63.3 |
62.5 |
76.3 |
85.5 |
Inpatient crude death rate
DHISa |
2024/25 |
4.7 |
6.1 |
4.1 |
5.2 |
4.7 |
4.7 |
4.5 |
5.1 |
4.9 |
3.4 |
Inpatient deaths - total
DHISa |
2024/25 |
163 234 |
24 472 |
9 672 |
36 936 |
32 895 |
16 076 |
10 546 |
3 942 |
9 238 |
19 457 |
| DHIS District Hospitala |
71 478 |
13 217 |
4 114 |
6 405 |
15 788 |
9 741 |
6 572 |
1 659 |
3 542 |
10 440 |
| DHIS National Central Hospitala |
20 970 |
1 303 |
638 |
13 098 |
635 |
5 296 |
|
|
|
|
| DHIS Provincial Tertiary Hospitala |
22 095 |
3 990 |
1 226 |
4 821 |
3 312 |
2 418 |
1 969 |
1 222 |
2 978 |
159 |
| DHIS Regional Hospitala |
45 812 |
5 478 |
2 931 |
12 549 |
12 808 |
3 899 |
1 998 |
617 |
2 710 |
2 822 |
Number of health facilities
DHIS District Hospitala |
March 2025 |
253 |
65 |
25 |
12 |
42 |
30 |
23 |
11 |
12 |
33 |
| DHIS Fixed CHCa |
344 |
43 |
11 |
44 |
22 |
26 |
41 |
33 |
48 |
76 |
| DHIS Fixed clinicala |
3 155 |
735 |
210 |
331 |
589 |
450 |
257 |
130 |
270 |
183 |
| DHIS Military Hospitala |
3 |
1 |
0 |
1 |
1 |
0 |
0 |
0 |
0 |
0 |
| DHIS National Central Hospitala |
9 |
1 |
1 |
4 |
1 |
2 |
0 |
0 |
0 |
0 |
| DHIS Provincial Tertiary Hospitala |
18 |
3 |
1 |
3 |
3 |
2 |
2 |
1 |
2 |
1 |
| DHIS Regional Hospitala |
47 |
5 |
4 |
9 |
12 |
5 |
3 |
1 |
3 |
5 |
| DHIS Specialised Hospitala |
8 |
2 |
3 |
0 |
3 |
18 |
0 |
0 |
0 |
0 |
| DHIS Specialised Psychiatric Hospitala |
23 |
4 |
1 |
3 |
5 |
3 |
1 |
0 |
2 |
4 |
| DHIS Specialised TB Hospitala |
25 |
10 |
3 |
0 |
0 |
1 |
4 |
1 |
6 |
0 |
OPD new client not referred rate
DHISa |
2024/25 |
41.1 |
48.4 |
47.6 |
22.9 |
44.7 |
59.7 |
56.8 |
61.9 |
29.5 |
10.5 |
Percentage Ideal Clinics
IC Statusf |
2024/25 |
80 |
62 |
93 |
95 |
95 |
61 |
96 |
40 |
97 |
79 |
PHC headcount 5 years and older
DHISa |
2024/25 |
88 355 922 |
11 635 265 |
4 373 711 |
16 463 575 |
20 381 739 |
9 987 897 |
6 860 820 |
2 386 439 |
6 055 827 |
10 210 649 |
PHC headcount under 5 years
DHISa |
2024/25 |
16 748 674 |
1 972 255 |
729 210 |
3 117 777 |
3 885 627 |
2 339 534 |
1 459 053 |
384 345 |
1 130 032 |
1 730 841 |
PHC headcount total
DHISa |
2024/25 |
105 104 596 |
13 607 520 |
5 102 921 |
19 581 352 |
24 267 366 |
12 327 431 |
8 319 873 |
2 770 784 |
7 185 859 |
11 941 490 |
PHC utilisation rate
DHISa |
2024/25 |
1.7 |
1.9 |
1.7 |
1.2 |
2 |
1.9 |
1.6 |
2 |
1.7 |
1.6 |
PHC utilisation rate under 5 years
DHISa |
2024/25 |
2.8 |
2.5 |
2.6 |
2.5 |
3 |
3.2 |
3 |
2.8 |
2.8 |
3 |
REFERENCE NOTES
a DHIS
b CMS 2025
c Stats SA Recorded Live Births 2024
d Stats SA Mortality and Causes of Death 2023
e World Health Statistics 2026
f Ideal Clinic System
DEFINITIONS
Average length of stay - total [Days] — The average number of patients days that an admitted patients spends in hospital before separation.
Birth registration coverage [Percentage] — Percentage of births that are registered within one month of age in the civil registration system.
Complaints resolution rate [Percentage] — Complaints resolved as a proportion of complaints received.
Death registration coverage [Percentage] — Percentage of deaths that are registered (with age and sex).
Hospital beds per 10 000 target population — Number of inpatient beds per 10 000 target population. For public sector beds, the uninsured population is used as the target.
Inpatient bed utilisation rate - total [Percentage] — A measure of the average number of beds that are occupied - expressed as the proportion of all available bed days, which is calculated as the number of actual beds multiplied by the average number of days in a month (30.42).
Inpatient crude death rate [Percentage] — Proportion of admitted clients/separations who died during hospital stay. Inpatient separations is the total of day clients, inpatient discharges, inpatient deaths and inpatient transfer outs.
Inpatient deaths - total [Number] — An inpatient death is a death recorded against an admitted inpatient, including the death of a patient admitted earlier on the same day. The total is specialities plus all others that do not appear on the identified specialities.
International Health Regulations (IHR) core capacity index [Percentage] — Percentage of attributes of 13 core capacities that have been attained at a specific point in time. The 13 core capacities are: (1) National legislation, policy and financing; (2) Coordination and National Focal Point communications; (3) Surveillance; (4) Response; (5) Preparedness; (6) Risk communication; (7) Human resources; (8) Laboratory; (9) Points of entry; (10) Zoonotic events; (11) Food safety; (12) Chemical events; (13) Radionuclear emergencies.
Number of beds [Number] — Total number of beds in health facility.
Number of health facilities [Number] — Total number of health facilities.
OPD new client not referred rate [Percentage] — New outpatient department clients who were not referred, as a proportion of total new outpatient department clients. A high rate indicates that patients are bypassing primary health care facilities and presenting directly at hospital outpatient departments.
Percentage Ideal clinics [Percentage] — Percentage of fixed PHC facilities assessed on the ideal clinic dashboard that achieved Ideal Clinic status (silver, gold, platinum or diamond status).
PHC headcount [Number] — The number of individual clients seen for primary health care services at a facility during the reporting period. PHC headcount under 5 years counts clients who have not yet reached five years (60 months) of age; PHC headcount 5 years and older counts clients aged five years and above; PHC headcount total is the sum of the two.
PHC utilisation rate [Average number of visits per person] — Average number of PHC visits per person per year in the population.
PHC utilisation rate under 5 years [Average number of visits per person under 5 years] — Average number of PHC visits per year per person under 5 years of age in the population.
Health personnel
In March 2025, the public health sector employed 73 583 professional nurses, 27 471 enrolled nurses, 32 911 nursing assistants, 15 309 medical practitioners and 6 557 medical specialists, supported by smaller cadres of pharmaceutical personnel, a PERSAL category that combines pharmacists with pharmacist’s assistants and pharmacy technicians, (3 586), radiographers (2 857), physiotherapists (1 188) and psychologists (810) (Table 13).117 These payroll counts sit alongside a much larger licensed pool: the SANC registered 157 097 professional nurses at the end of 2024, more than twice the number on the public payroll.118 Counting both sectors, WHO estimates South Africa’s density of medical doctors at 7.7 per 10 000 population and of nursing and midwifery personnel at 41.5 per 10 000, figures that place the country above the WHO African Region average, although the more informative comparison for an upper-middle-income country is with its income peers, against which South Africa’s densities remain low, and that depend, as discussed below, on registers rather than counts of who is actually practising (Table 14).54
Distribution tells two different stories. Professional nurses are spread with more equity than almost any other indicator in this paper: their density ranges only from 103.6 per 100 000 uninsured population in the Western Cape to 173 in the Eastern Cape, and it is the poorer provinces that record the higher ratios.80,117 Public sector medical practitioners cluster similarly, between 25.2 (Limpopo) and 40.2 (Northern Cape) per 100 000. Specialists break the pattern entirely. Specialist distribution is markedly more unequal than the distribution of professional nurses and general medical practitioners. This pattern is consistent with national human-resources assessments identifying persistent workforce disparities between provinces, between urban and rural areas, and between the public and private sectors.119 Gauteng and the Western Cape together employ 3 989 of the country’s 6 557 public sector specialists, six in every ten, and specialist density spans a twelvefold range from 2.2 per 100 000 uninsured population in Mpumalanga to 26.9 in the Western Cape (Figure 20). The gradient steepens with sub-specialisation: 110 of the country’s 138 public dental specialists work in Gauteng, a concentration that partly reflects the location in that province of a dental school offering specialist training. The zero counts of dental specialists recorded for some provinces illustrate how much an administrative workforce count depends on the field used to classify a post. Interrogation of the Eastern Cape PERSAL establishment records for March 2025 identifies three orthodontists and one maxillofacial and oral surgeon in filled, funded posts, none of whom would appear in a count built on rank or job title where the three orthodontists are carried as clinical managers and a medical officer, and the surgeon is classified occupationally as a public health medicine specialist, with the dental nature of the post recorded only in a supplementary specialist field populated for fewer than one in a hundred records. An apparent absence of specialists in these data should therefore be read as a question about post classification rather than as evidence that the service is unavailable.
Mental health capacity shows the same fragility, with 810 public sector psychologists nationally and 16 in the whole of the Northern Cape. The community service programme operates as a partial counterweight, placing its largest doctor cohorts in Mpumalanga (325), North West (304) and Limpopo (272), precisely the provinces the permanent workforce avoids.117
Community health workers, the cadre through which ward-based outreach teams reach households, are conspicuous by their absence from these tables. Historically, CHWs were engaged on varied contractual arrangements that kept many outside PERSAL, making the base of the primary health care workforce pyramid, in effect, unmeasured in the routine sources, and limiting any assessment of whether community-based services are staffed in proportion to need. However, following a milestone Johannesburg Labour Court ruling and subsequent bargaining agreements finalised in late 2025 by unions, the PERSAL framework will be updated to reflect permanent Public Service Salary Level 2 status for approximately 27 000 eligible CHWs, with the exception of the Western Cape province, which has opted to keep their management via NGOs.120
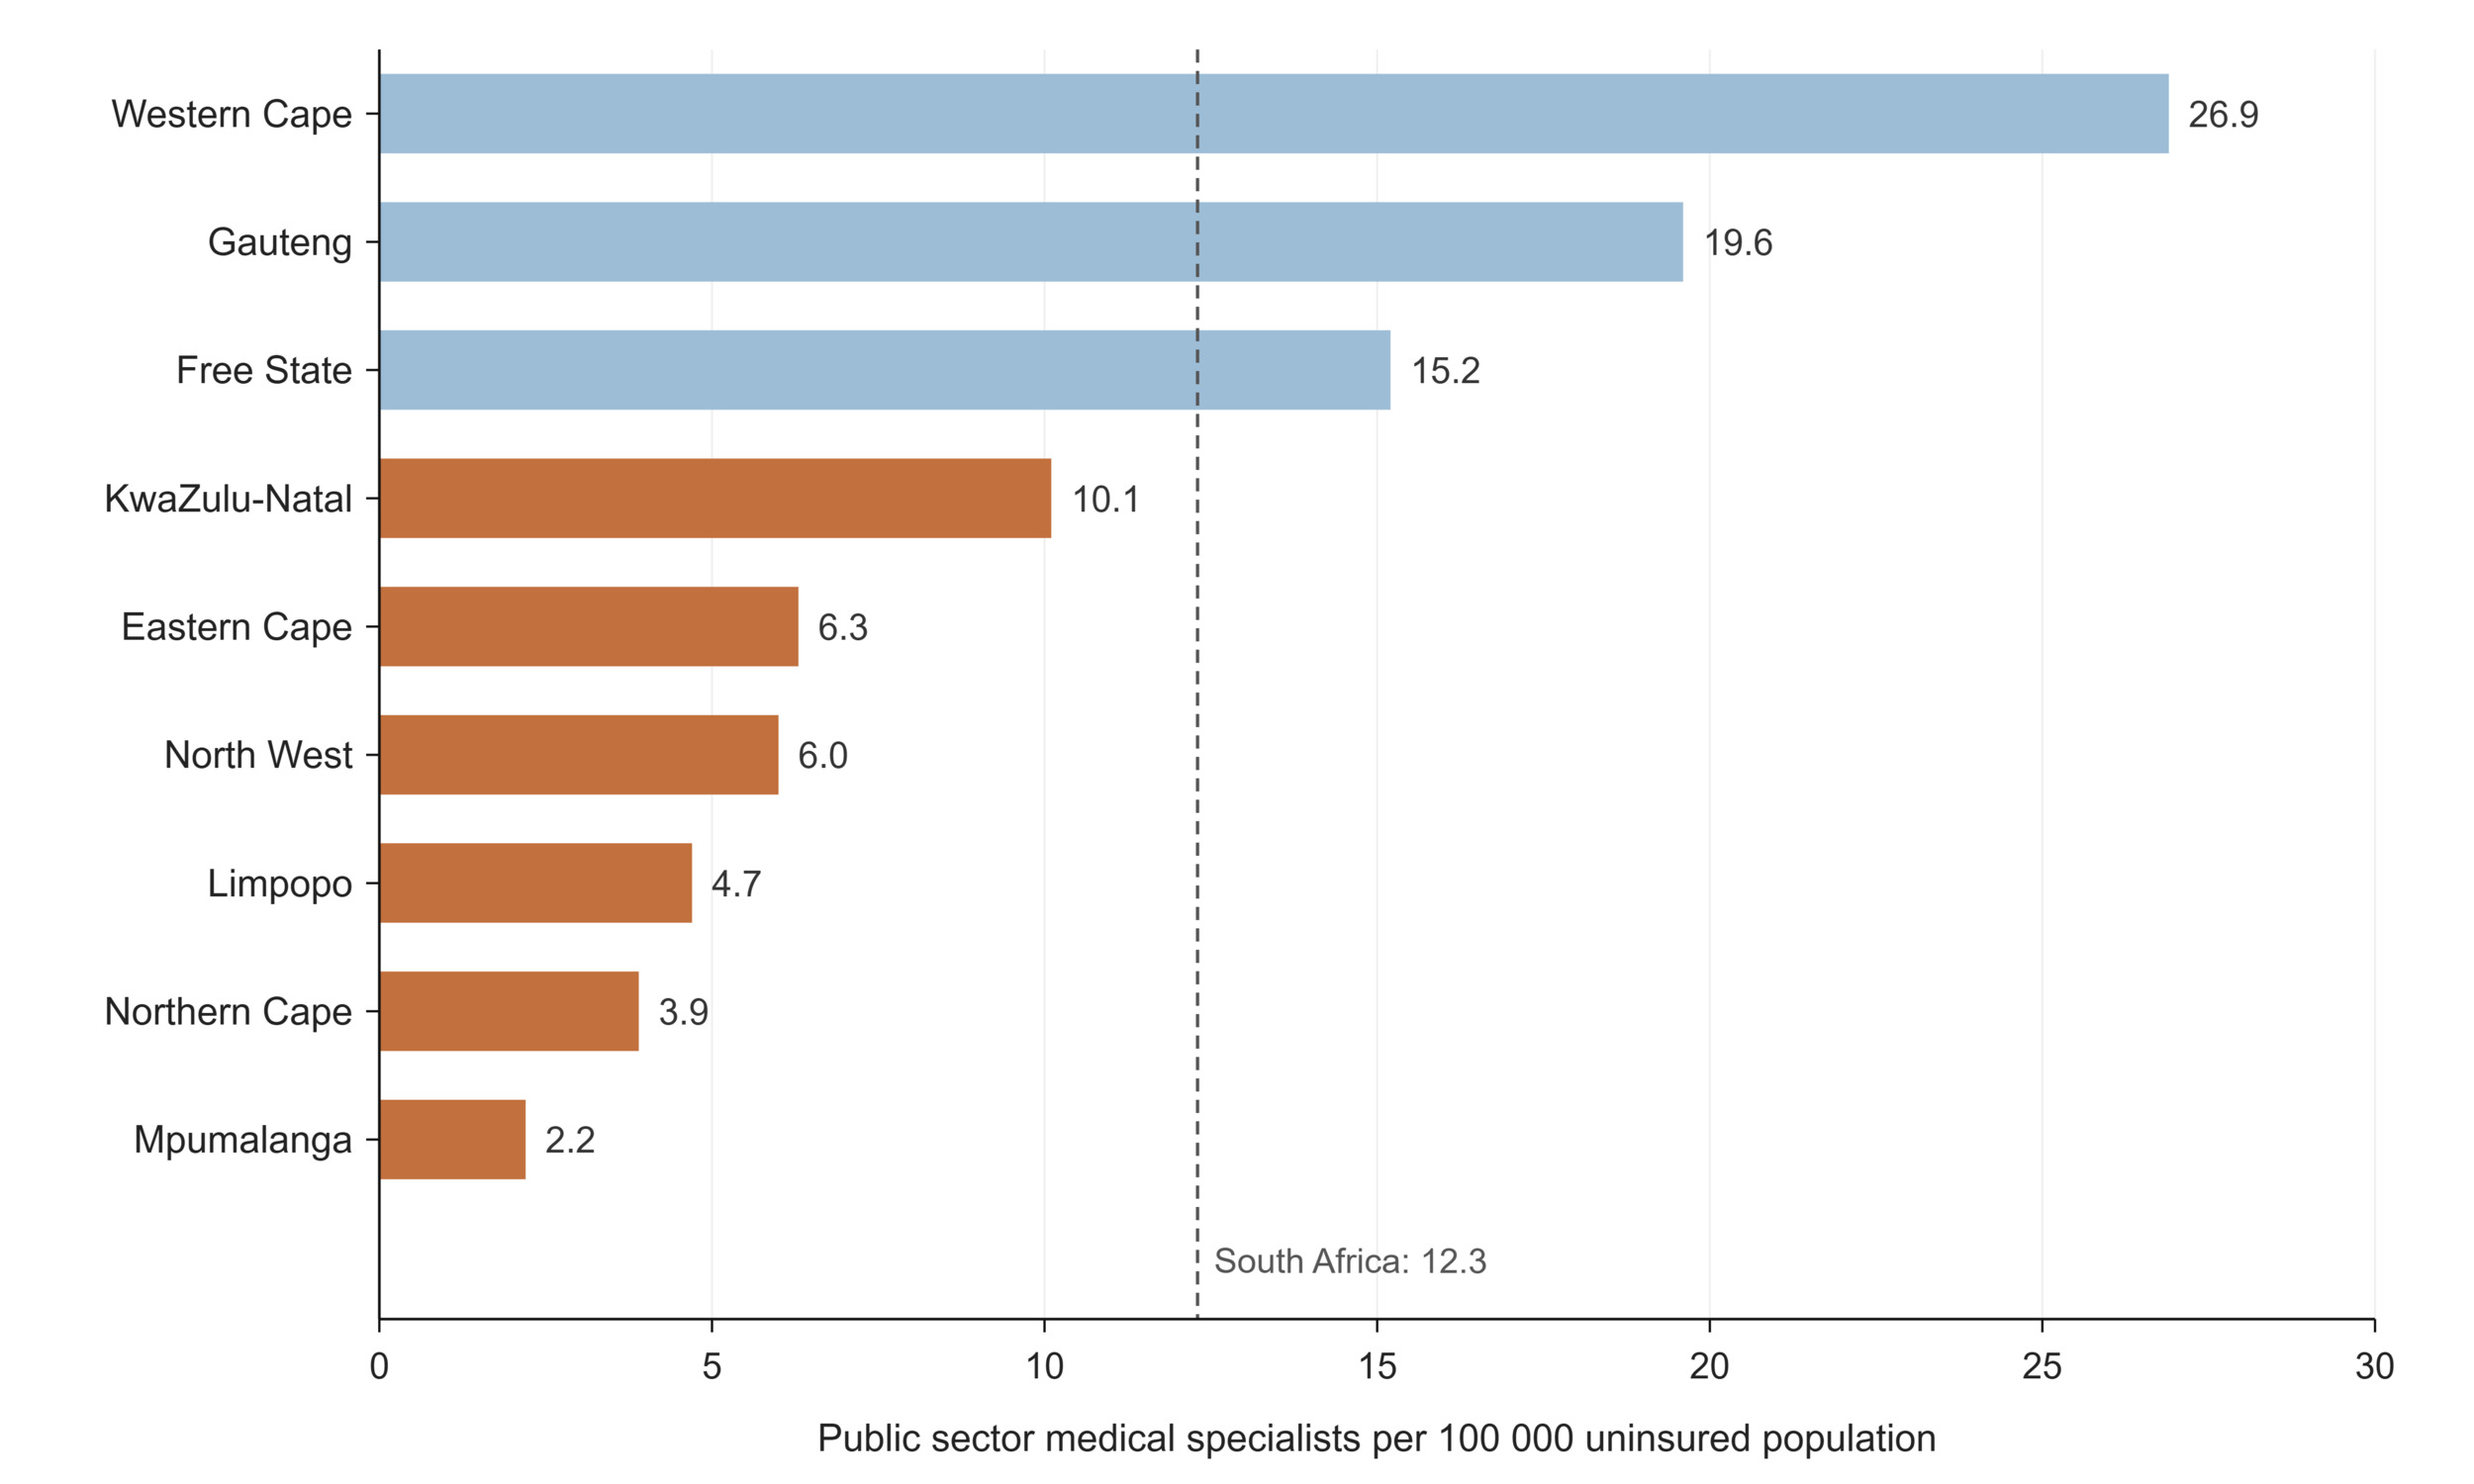
Figure 20.Public sector medical specialists per 100 000 uninsured population by province, March 2025
The pipeline raises harder questions than the stock. Nearly half of registered nurses and midwives (48%) are aged 50 or older, with 27% in their fifties, 18% in their sixties and 3% still registered past 69. With almost half of registered nurses and midwives aged 50 or older, the age structure signals substantial potential retirement and replacement pressure over the next 10 to 15 years. The exact number requiring replacement cannot be derived from the register alone, because registration does not confirm active employment and retirement timing varies.118,121 SANC recorded 16 224 nursing students nationally in 2024, while the public payroll carried just 518 student nurses with 476 of them in KwaZulu-Natal.122 The two student figures measure different populations. SANC records students enrolled in accredited nursing programmes, while PERSAL captures only student nurses appointed through the public payroll. The transition from legacy nursing programmes to Higher Education Qualifications Sub-Framework-aligned qualifications from 2020 also changed programme accreditation and institutional arrangements, further limiting direct comparison between the two counts.123
Medicine presents the inverse problem of production without absorption. Around 1 260 doctors who had completed community service were unemployed in early 2026, even as roughly 1 100 medical posts stood vacant, and the 2025 budget provided for the appointment of only 800 of an estimated 1 500 to 1 800 unemployed doctors. The same mismatch is reported for pharmacy graduates, where community service placements and funded posts have not kept pace with the number of graduates entering the system in a year in which the public sector lost some 9 000 health workers.124-126 Vacancy rates for medical officers ranged from 5.5% in the Western Cape to 22.4% in the Free State in 2024. The constraint is not the supply of clinicians but the funding and administration of posts, and its cost is paid in emigration and eroded morale.124
Underlying all of these numbers is an instrument problem. The workforce figures in this section come from a payroll system, three statutory registers, and an international observatory, and they do not agree because they measure different things: employment, licensure, and modelled density, respectively. The register exceeds the public payroll for every profession, and the gap conflates private practice, inactivity, retirement and emigration without any way to separate them, because councils do not capture activity status when professionals renew their registration.119 The sources available for this paper did not provide a comprehensive, routinely updated count of active private sector health professionals by occupation and province. Although South Africa is strengthening its HRH information architecture through an integrated HRH information system and National Health Workforce Accounts, private sector information remains incompletely integrated into the national workforce picture.127
Even the ratios are unstable ground: public sector densities divide by estimates of the uninsured population, so they move when the population series is rebased or medical scheme membership shifts, independently of any hiring or resignation.
Learning signals: health personnel
What does the data reveal? The public nursing workforce is distributed with striking equity, and poorer provinces are comparatively well staffed with nurses relative to their dependent populations. Specialist care is the opposite: a twelvefold provincial gap concentrates specialist capacity in WC, GP and the academic centres of FS, so that equity of access deteriorates as care becomes more complex. Beneath both patterns sits an ageing register (nearly half of registered nurses are 50 or older) and a paradox that defines the current moment: newly qualified doctors are unemployed while funded and unfunded posts stand vacant.
Is the system responding? The community service programme, in place since 1998, remains the clearest example of a policy lever that deliberately redistributes new professionals toward underserved provinces, and the placement data shows it still working as designed: MP, NW and LP receive some of the largest community service doctor cohorts in the country. The 2030 Human Resources for Health Strategy is also unusually candid in diagnosing the workforce information gaps described below.119 What is missing is a closed loop between training and employment: the National Health Council approved emergency hiring of 1 200 doctors in April 2025, and the 2025 budget funded 800 post-community-service posts against an estimated 1 500 to 1 800 unemployed doctors. These are corrections after the fact. Universities plan enrolment, provinces fund posts, and no institution reconciles the two before graduates arrive on the labour market.
What prevents learning? South Africa cannot currently answer the question of how many health professionals are actually practising, because each instrument measures something different: PERSAL counts public payroll, the professional councils count licences (including the retired, the emigrated and the privately employed, without distinguishing them), and international densities republish register-derived figures. For professional nurses, the instruments disagree by a factor of two, with 157 097 on the register and 73 583 on the public payroll, and the difference cannot be decomposed into private employment, inactivity and emigration because activity status is not captured at re-registration. The private health workforce has no routine count at all. Workforce ratios inherit the population-denominator problem documented throughout this paper, since public sector ratios divide by estimates of the uninsured population that shift with both the population series and medical scheme coverage. A system that cannot count its workforce cannot model its future, which is why workforce planning keeps resolving into crisis management. |
Table 13.Human resources for health indicators
| Indicator |
Period |
SA |
EC |
FS |
GP |
KZ |
LP |
MP |
NC |
NW |
WC |
Number of clinical associates
both sexes public sectora |
2025 Mar |
290 |
74 |
18 |
52 |
69 |
6 |
51 |
2 |
18 |
0 |
Number of CS clinical psychologists
both sexes public sectora |
2025 Mar |
81 |
1 |
3 |
48 |
11 |
7 |
1 |
3 |
|
7 |
Number of CS dentists
both sexes public sectora |
2025 Mar |
196 |
16 |
25 |
34 |
39 |
16 |
15 |
13 |
24 |
14 |
Number of CS doctors
both sexes public sectora |
2025 Mar |
2 417 |
250 |
86 |
453 |
307 |
272 |
325 |
70 |
304 |
350 |
Number of CS environmental health practitioners
both sexes public sectora |
2025 Mar |
196 |
4 |
19 |
36 |
19 |
41 |
25 |
13 |
38 |
1 |
Number of CS nurses
both sexespublic sectora |
2025 Mar |
1 896 |
549 |
78 |
382 |
19 |
70 |
181 |
90 |
239 |
288 |
Number of CS occupational therapists
both sexes public sectora |
2025 Mar |
743 |
116 |
48 |
182 |
140 |
27 |
59 |
47 |
80 |
44 |
Number of CS pharmacists
both sexes SAPCb |
2026 |
836 |
107 |
24 |
204 |
187 |
109 |
64 |
13 |
51 |
77 |
| both sexes public sectora |
2025 Mar |
708 |
58 |
30 |
155 |
120 |
187 |
38 |
19 |
46 |
55 |
Number of CS radiographers
both sexes public sectora |
2025 Mar |
434 |
27 |
12 |
126 |
62 |
56 |
41 |
15 |
53 |
42 |
Number of CS speech therapists
both sexes public sectora |
2025 Mar |
286 |
33 |
7 |
73 |
87 |
18 |
21 |
9 |
31 |
7 |
Number of pharmacists
both sexes SAPCb |
2026 |
17 435 |
2 058 |
604 |
6 349 |
3 044 |
1 010 |
920 |
304 |
1 155 |
3 146 |
Number of pharmacists
both sexes WHOc |
2024 |
18 313 |
|
|
|
|
|
|
|
|
|
Number of pharmaceutical technicians and assistants
both sexes WHOc |
2024 |
21 569 |
|
|
|
|
|
|
|
|
|
Number of dental practitioners
both sexes public sectora |
2025 Mar |
645 |
70 |
25 |
151 |
77 |
144 |
61 |
20 |
23 |
74 |
Number of dental specialists
both sexes public sectora |
2025 Mar |
138 |
|
1 |
110 |
1 |
5 |
2 |
0 |
|
19 |
Number of dental therapists
both sexes public sectora |
2025 Mar |
166 |
4 |
2 |
41 |
52 |
35 |
15 |
3 |
12 |
2 |
Number of enrolled nurses
both sexes public sectora |
2025 Mar |
27 471 |
3 351 |
976 |
6 730 |
9 120 |
2 631 |
863 |
194 |
964 |
2 642 |
| female SANCd |
2024 Dec |
43 806 |
3 443 |
1 312 |
11 060 |
15 851 |
3 682 |
1 434 |
257 |
2 169 |
4 598 |
| male SANCd |
5 248 |
756 |
327 |
1 065 |
1 819 |
436 |
162 |
37 |
269 |
377 |
| both sexes SANCd |
49 054 |
4 199 |
1 639 |
12 125 |
17 670 |
4 118 |
1 596 |
294 |
2 438 |
4 975 |
Number of environmental health practitioners
both sexes public sectora |
2025 Mar |
431 |
16 |
85 |
139 |
77 |
24 |
47 |
15 |
28 |
18 |
Number of medical practitioners
both sexes public sectora |
2025 Mar |
15 309 |
1 749 |
660 |
4 078 |
3 598 |
1 185 |
1 064 |
396 |
1 052 |
1 527 |
Number of medical researchers
both sexes public sectora |
2025 Mar |
50 |
1 |
2 |
10 |
3 |
19 |
6 |
1 |
2 |
6 |
Number of medical specialists
both sexes public sectora |
2025 Mar |
6 557 |
406 |
405 |
2 467 |
1 125 |
273 |
98 |
45 |
216 |
1 522 |
Number of nursing assistants
both sexes public sectora |
2025 Mar |
32 911 |
4 964 |
1 994 |
6 673 |
5 379 |
4 311 |
2 060 |
745 |
2 647 |
4 138 |
| female SANCd |
2024 Dec |
54 604 |
4 982 |
2 280 |
14 840 |
10 416 |
8 492 |
3 400 |
713 |
3 360 |
6 121 |
| male SANCd |
5 122 |
944 |
292 |
988 |
1 009 |
740 |
196 |
67 |
399 |
487 |
| both sexes SANCd |
59 726 |
5 926 |
2 572 |
15 828 |
11 425 |
9 232 |
3 596 |
780 |
3 759 |
6 608 |
Number of occupational therapists
both sexes public sectora |
2025 Mar |
944 |
87 |
40 |
294 |
129 |
114 |
53 |
25 |
40 |
162 |
Number of optometrists and opticians
both sexes public sectora |
2025 Mar |
257 |
8 |
7 |
62 |
62 |
94 |
9 |
1 |
5 |
9 |
Number of pharmacuetical personnel
both sexes public sectora |
2025 |
3 586 |
425 |
126 |
572 |
899 |
532 |
297 |
86 |
244 |
405 |
Number of physiotherapists
both sexes public sectora |
2025 Mar |
1 188 |
129 |
54 |
250 |
262 |
147 |
81 |
33 |
77 |
155 |
Number of professional nurses
both sexes public sectora |
2025 Mar |
73 583 |
10 581 |
3 306 |
16 282 |
16 997 |
7 846 |
6 675 |
1 442 |
4 872 |
5 582 |
| female SANCd |
138 017 |
14 214 |
7 135 |
38 150 |
30 804 |
11 446 |
7 832 |
2 098 |
9 486 |
16 852 |
| male SANCd |
19 080 |
2 594 |
1 328 |
3 876 |
4 288 |
1 880 |
1 342 |
285 |
1 706 |
1 781 |
| both sexes SANCd |
157 097 |
16 808 |
8 463 |
42 026 |
35 092 |
13 326 |
9 174 |
2 383 |
11 192 |
18 633 |
Number of psychologists
both sexes public sectora |
2025 Mar |
810 |
87 |
32 |
239 |
103 |
131 |
54 |
16 |
39 |
109 |
Number of radiographers
both sexes public sectora |
2025 Mar |
2 857 |
349 |
160 |
836 |
579 |
214 |
118 |
68 |
114 |
419 |
Number of speech therapists and audiologists
both sexes public sectora |
2025 Mar |
592 |
53 |
14 |
157 |
145 |
46 |
48 |
15 |
30 |
84 |
Number of student nurses
both sexes public sectora |
2025 Mar |
518 |
31 |
|
|
476 |
11 |
0 |
18 |
|
|
| female SANCd |
2024 Dec |
12 647 |
2 047 |
821 |
3 901 |
1 326 |
952 |
491 |
62 |
1 174 |
1 873 |
| male SANCd |
3 577 |
766 |
212 |
801 |
603 |
377 |
106 |
19 |
304 |
389 |
| both sexes SANCd |
16 224 |
2 813 |
1 033 |
4 702 |
1 929 |
1 329 |
597 |
81 |
1 478 |
2 262 |
REFERENCE NOTES
a PERSAL
b SAPC
c WHO Observatory
d SANC
Table 14.Human resources for health - ratios
| Indicator |
Period |
SA |
EC |
FS |
GP |
KZ |
LP |
MP |
NC |
NW |
WC |
Clinical Associates per 100 000 population
both sexes public sectora |
2025 Mar |
0.5 |
1.2 |
0.7 |
0.4 |
0.6 |
0.1 |
1.1 |
0.2 |
0.5 |
|
Dental practitioners per 100 000 population
both sexes public sectora |
2025 Mar |
1.6 |
1.3 |
1.9 |
1.5 |
1 |
2.8 |
1.7 |
2.8 |
1.3 |
1.6 |
Dental specialists per 100 000 population
both sexes public sectora |
2025 Mar |
0.3 |
|
0.0 |
0.9 |
0.0 |
0.1 |
0.0 |
0 |
|
0.3 |
Dental therapists per 100 000 population
both sexes public sectora |
2025 Mar |
0.3 |
0.1 |
0.1 |
0.3 |
0.5 |
0.6 |
0.3 |
0.3 |
0.3 |
0.0 |
Enrolled nurses per 100 000 population
both sexes public sectora |
2025 Mar |
51.4 |
52.1 |
36.6 |
53.4 |
82.2 |
45.5 |
19 |
16.8 |
26.8 |
46.6 |
Medical practitioners per 100 000 population
both sexes public sectora |
2025 Mar |
33.2 |
31.1 |
28 |
36 |
35.2 |
25.2 |
30.5 |
40.2 |
37.7 |
33.1 |
Nursing assistants per 100 000 population
both sexes public sectora |
2025 Mar |
61.6 |
77.1 |
74.7 |
53 |
48.5 |
74.6 |
45.3 |
64.3 |
73.5 |
73 |
Occupational therapists per 100 000 population
both sexes public sectora |
2025 Mar |
3.2 |
3.2 |
3.3 |
3.8 |
2.4 |
2.4 |
2.5 |
6.2 |
3.3 |
3.6 |
Optometrists per 100 000 population
both sexes public sectora |
2025 Mar |
0.5 |
0.1 |
0.3 |
0.5 |
0.6 |
1.6 |
0.2 |
0.1 |
0.1 |
0.2 |
Pharmaceutical personnel per 100 000 population
both sexes public sectora |
2025 Mar |
16.7 |
16.7 |
19.1 |
11.6 |
21.9 |
18.1 |
13.8 |
23.7 |
13.1 |
18.6 |
Physiotherapists per 100 000 population
both sexes public sectora |
2025 Mar |
2.2 |
2 |
2 |
2 |
2.4 |
2.5 |
1.8 |
2.8 |
2.1 |
2.7 |
Professional nurses per 100 000 population
both sexes public sectora |
2025 Mar |
141.3 |
173 |
126.8 |
132.3 |
153.4 |
137 |
150.7 |
132.3 |
142 |
103.6 |
Radiographers per 100 000 population
both sexes public sectora |
2025 Mar |
6.2 |
5.8 |
6.4 |
7.6 |
5.8 |
4.7 |
3.5 |
7.2 |
4.6 |
8.1 |
Speech therapists and audiologists per
100 000 population
both sexes public sectora |
2025 Mar |
1.6 |
1.3 |
0.8 |
1.8 |
2.1 |
1.1 |
1.5 |
2.1 |
1.7 |
1.6 |
Student nurses per 100 000 population
both sexes public sectora |
2025 Mar |
1.0 |
|
|
0.3 |
4.3 |
0.2 |
0 |
|
|
|
Density of dentists (per 10 000 population)
both sexes WHOb |
2024 |
1.1 |
|
|
|
|
|
|
|
|
|
Density of nursing and midwifery personnel
(per 10 000 population)
both sexes WHOb |
2024 |
41.5 |
|
|
|
|
|
|
|
|
|
Density of pharmacists (per 10 000 population)
both sexes WHOb |
2024 |
2.8 |
|
|
|
|
|
|
|
|
|
Density of medical doctors (per 10 000 population)
both sexes WHOb |
2024 |
7.7 |
|
|
|
|
|
|
|
|
|
REFERENCE NOTES
a PERSAL
b World Health Statistics 2026
DEFINITIONS
Density of [cadre] (per 10 000 population) [per 10 000 population] — The ratio of the named cadre to the population, per 10 000 population, as reported in the WHO Global Health Observatory. The WHO series covers both public and private sectors and uses the total population as the denominator, so it is not directly comparable with the PERSAL-based ratios above.
Number of CS [health professional category] [Number] — Number of community service practitioners in the named category: health professionals completing the compulsory year of community service in the public sector.
Number of [health professional category] [Number] — Number of this category of health professional working in the specified sector. Public sector counts are drawn from PERSAL and reflect funded posts filled, classified by post category; practitioners classified under another post category are not visible in the count for their own category. Counts attributed to a statutory council (SANC, SAPC) are registrations rather than posts and include practitioners in both sectors as well as those registered but not practising. Note that in PERSAL clinical associates are a rank under medical practitioners and are therefore also included in the number of medical practitioners.
Number of pharmaceutical personnel [Number] — Number of personnel in PERSAL post categories covering pharmacists together with pharmacist’s assistants and pharmacy technicians. The figure is therefore wider than the number of registered pharmacists and the two should not be compared directly.
[Health professional category] per 100 000 population [per 100 000 population] — Ratio of the number of personnel in the named category to the population (per 100 000). Note that the measure of the number of personnel may differ for the public and private sectors, and that the population may be adjusted to the population assumed to be dependent on that sector; for public sector ratios the uninsured population is used.
Health financing
Public expenditure on health through the provincial sphere, including net local government spending on primary health care, reached R265.3 billion in 2024/25, up from R158.9 billion in 2015/16.80 That decade of growth, 67% in nominal terms or 5.9% per year, has run only marginally ahead of inflation, and once population growth is accounted for, real spending per person served has been broadly flat. The result is limited improvement in the resources available per person, compounded by health-sector input costs that may rise faster than general consumer inflation.125 The most recent year makes the constraint explicit: expenditure grew 3.7% between 2023/24 and 2024/25, below inflation, a real-terms decline. The COVID-19 pandemic is clearly legible in the series as a fiscal event rather than a new trajectory, total expenditure jumped 10% in 2020/21, driven substantially by a 64% surge in the Administration programme, before growth collapsed to under 2% the following year and the administrative spike unwound. The system absorbed the shock and returned to its prior path of constrained growth.
Within a flat real envelope, what changes is composition, and the compositional drift of the past decade tells its own story. District Health Services remains the largest programme and has grown its share of provincial health spending from 44.0% to 46.6% (R123.7 billion in 2024/25). But the fastest-growing large programme has been Central Hospital Services, up 81% nominally to R53.6 billion, expanding from 18.6% to 20.2% of the total and overtaking Provincial Hospital Services, whose share fell from 18.6% to 16.6%. The clearest casualty is Health Sciences and Training, which grew just 17.5% in nominal terms across the entire nine-year period, representing a real term cut of roughly a third, leaving a system that depends on its own training pipeline spending a shrinking fraction of its budget on producing the workforce the Health Personnel section describes. Emergency Health Services expenditure fell 11% in the latest year, but this decline should be read with caution: KwaZulu-Natal, a province of over twelve million people, recorded only R249 million against Gauteng’s R2.4 billion, a figure more plausibly reflecting a reclassification or recording change than a collapse in ambulance services. Health Facilities Management, by contrast, rose 18% in the latest year to R12.5 billion, a tentative recovery in capital and maintenance spending (Table 15 and Table 16).
Table 15.Provincial health expenditure by programme, 2024/25 (R million)
| Programme |
EC |
FS |
GP |
KZ |
LP |
MP |
NC |
NW |
WC |
| 1. Administration |
688 |
330 |
1 831 |
2 051 |
290 |
384 |
271 |
1 213 |
1 506 |
| 2. District Health Services |
16 193 |
6 036 |
22 438 |
27 280 |
16 343 |
11 459 |
3 080 |
8 251 |
12 660 |
| 3. Emergency Health Services |
1 526 |
1 018 |
2 362 |
249 |
1 271 |
549 |
436 |
501 |
1 386 |
| 4. Provincial Hospital Services |
4 444 |
1 693 |
12 544 |
13 191 |
2 940 |
1 861 |
530 |
2 381 |
4 443 |
| 5. Central Hospital Services |
5 154 |
3 311 |
22 790 |
5 908 |
2 299 |
2 085 |
1 175 |
2 494 |
8 368 |
| 6. Health Sciences and Training |
922 |
240 |
758 |
1 391 |
573 |
520 |
267 |
269 |
384 |
| 7. Healthcare Support Services |
120 |
166 |
463 |
308 |
169 |
400 |
138 |
707 |
550 |
| 8. Health Facilities Management |
1 263 |
720 |
2 107 |
3 418 |
849 |
1 708 |
445 |
715 |
1 257 |
| Local government expenditure |
304 |
52 |
2 898 |
433 |
91 |
115 |
34 |
57 |
1 314 |
| Grand Total |
30 613 |
13 566 |
68 191 |
54 230 |
24 826 |
19 081 |
6 375 |
16 586 |
31 866 |
Source: National Treasury databases
Table 16.Trends in provincial health expenditure by programme (nominal prices, R million)
| Programme |
FY 2016 |
FY 2017 |
FY 2018 |
FY 2019 |
FY 2020 |
FY 2021 |
FY 2022 |
FY 2023 |
FY 2024 |
FY 2025 |
| 1. Administration |
4 313 |
4 462 |
4 690 |
5 129 |
5 368 |
8 799 |
7 596 |
7 273 |
7 207 |
8 563 |
| 2. District Health Services |
69 854 |
76 540 |
83 671 |
90 978 |
98 688 |
109 448 |
115 084 |
116 406 |
118 957 |
123 740 |
| 3. Emergency Health Services |
6 025 |
6 435 |
7 380 |
7 671 |
8 394 |
8 660 |
8 791 |
9 817 |
10 464 |
9 298 |
| 4. Provincial Hospital Services |
29 576 |
29 675 |
32 262 |
34 275 |
36 609 |
37 623 |
39 134 |
40 607 |
43 442 |
44 027 |
| 5. Central Hospital Services |
29 529 |
33 736 |
37 437 |
41 120 |
44 608 |
47 516 |
47 227 |
50 010 |
51 560 |
53 584 |
| 6. Health Sciences and Training |
4 529 |
5 107 |
4 916 |
5 037 |
5 115 |
4 796 |
4 792 |
5 270 |
5 314 |
5 323 |
| 7. Health Care Support Services |
2 834 |
1 796 |
1 806 |
4 661 |
2 301 |
3 469 |
3 073 |
2 936 |
3 072 |
3 020 |
| 8. Health Facilities Management |
8 514 |
8 316 |
8 651 |
9 014 |
9 844 |
11 526 |
10 433 |
10 236 |
10 574 |
12 482 |
| Local government expenditure |
3 730 |
4 103 |
4 199 |
4 858 |
4 828 |
5 392 |
5 158 |
5 140 |
5 285 |
5 297 |
| Other |
0 |
|
|
0 |
0 |
0 |
-14 |
0 |
0 |
0 |
| Grand Total |
158 903 |
170 171 |
185 013 |
202 744 |
215 755 |
237 229 |
241 273 |
247 697 |
255 877 |
265 335 |
Source: National Treasury databases
The provincial allocation of these funds is best read against the population each province actually serves (Table 15). Expenditure on District Health Services per capita of the uninsured population stood at R2 408 nationally in 2024/25 (real prices), ranging from R2 027 in Gauteng to R2 795 in Limpopo, while PHC expenditure per uninsured capita averaged R1 490, from R1 350 in Mpumalanga to R1 664 in the Northern Cape.80 The spread in per capita primary care spending, around 23% between highest and lowest, is strikingly narrow compared with the 30-percentage-point provincial gaps documented for water, sanitation, and unemployment earlier in this paper. On this evidence, the equitable share mechanism is doing its distributive work at the primary care level. Gauteng’s apparently low per capita district health spending is less paradoxical once programme structure is considered: Gauteng devotes a third (33.4%) of its budget to central hospitals, and together with the Western Cape accounts for 58% of national central hospital expenditure. This concentration is consistent with the statutory role of central hospitals, which provide highly specialised and supra-provincial referral services, train health professionals, conduct research and serve as major medical-school teaching platforms.
Rural provinces show the mirror image, with Limpopo directing 65.8% and Mpumalanga 60.1% of their budgets to District Health Services (Table 17). Unit costs vary far more than allocations: expenditure per patient day equivalent in district hospitals averaged R3 710 but spanned a near-twofold range from R2 543 in the Free State to R5 008 in North West, and PHC expenditure per headcount ranged from R657 in Limpopo to R961 in Gauteng against a national R754. The data alone cannot say how much of this reflects inefficiency, case mix, scale, or differences in utilisation, which is precisely the kind of question a learning system would be equipped to pursue.
Two structural features of health financing sit behind these provincial figures and deserve explicit mention. First, conditional grants, most prominently the District Health Programmes Grant that underpins much of the HIV response, accounted for approximately 22% of provincial health expenditure in 2024/25. These funds are subject to nationally determined purposes and conditions, meaning that a substantial share of provincial health budgets cannot be freely reprioritised by provinces, with implications for their ability to respond flexibly to priorities emerging from their own data.126 Second, the National Health Insurance Act, signed into law in May 2024, commits the country to a fundamental reorganisation of health purchasing. Whatever its implementation timetable, the information requirements of a national single-payer and strategic purchasing system, including beneficiary registration, provider accreditation and utilisation data spanning both sectors, would demand precisely the data integration whose absence this paper repeatedly documents.127
Table 17.District Health Services expenditure by sub-programme, 2024/25 (R million)
| Sub-programme |
EC |
FS |
GP |
KZ |
LP |
MP |
NC |
NW |
WC |
| 2.1 District Management |
1 020 |
155 |
1 227 |
402 |
543 |
617 |
428 |
858 |
656 |
| 2.2 Community Health Clinics |
3 359 |
1 260 |
2 853 |
5 120 |
3 983 |
2 074 |
652 |
1 420 |
1 718 |
| 2.3 Community Health Centres |
1 563 |
199 |
2 705 |
2 302 |
652 |
1 362 |
462 |
1 551 |
2 967 |
| 2.4 Community-based Services |
819 |
712 |
3 394 |
1 189 |
716 |
20 |
3 |
|
510 |
| 2.5 Other Community Services |
72 |
832 |
|
|
669 |
165 |
|
592 |
0 |
| 2.6 HIV/AIDS |
2 839 |
1 862 |
6 967 |
6 618 |
1 988 |
2 574 |
623 |
1 881 |
1 982 |
| 2.7 Nutrition |
24 |
15 |
3 |
23 |
4 |
4 |
6 |
0 |
71 |
| 2.8 Coroner Services |
149 |
54 |
380 |
296 |
53 |
|
|
|
0 |
| 2.9 District Hospitals |
6 347 |
1 779 |
4 909 |
9 910 |
7 788 |
4 808 |
744 |
1 891 |
4 757 |
| Grand Total |
16 193 |
6 036 |
22 438 |
27 280 |
16 343 |
11 459 |
3 080 |
8 251 |
12 660 |
Source: National Treasury databases
A substantial part of South Africa’s health financing system lies outside provincial public accounts, principally through medical schemes and direct household payments (Table 18). Statistics South Africa estimated household out-of-pocket health expenditure at R31.5 billion in 2022/23, with medicines and health products accounting for the largest component.128 Medical schemes covered 9.17 million beneficiaries in 2024, 14.6% of the population on the Council for Medical Schemes’ own reckoning, 15.5% on household self-report in the GHS, which is a household sample survey rather than a complete count, two measures close enough to corroborate one another but different enough to matter when either is used as a denominator.8,13 Coverage is profoundly uneven, from 8.2% in Limpopo and 9.5% in KwaZulu-Natal, to 22.1% in Gauteng and 25.9% in the Western Cape,8 and Gauteng alone is home to roughly 39% of all scheme beneficiaries. The two figures measure different things: the provincial percentages are the share of each province’s own population covered by a scheme, while the 39% is Gauteng’s share of the national beneficiary pool. This is the financing dimension of the pattern established in the demographic section: the provinces with the heaviest dependency burdens are those where the public purse carries more than nine in ten residents. The schemes’ pensioner ratio of 9.8% (10.9% among female members, 8.5% among male) signals a gradually ageing risk pool with predictable consequences for contribution affordability.13 Finally, external assistance is a marginal financing source at the aggregate level: official development assistance to health amounted to US$1.22 per capita in 2023, meaning South Africa’s low aggregate dependence on external health financing provides a degree of macro-level resilience. However, specific programmes, personnel, community services and information-system functions may remain highly exposed to changes in donor support.54
Where the district health rand actually goes completes the picture. Of the R123.7 billion District Health Services budget, district hospitals absorb 34.7%, the HIV/AIDS sub-programme 22.1% (R27.3 billion), community health clinics 18.1% and community health centres 11.1%. The nutrition sub-programme receives R150 million nationally, 0.12% of district health spending, a budgetary near-invisibility that sits uncomfortably against the burden of malnutrition documented in the Nutrition section of this paper. Sub-programme comparisons across provinces, however, quickly reach the limits of the classification system: Gauteng records R3.4 billion under community-based services where Mpumalanga records R20 million and North West R3 million, and several provinces record nothing at all under other community services.80
Learning signals: health financing
What does the data reveal? A decade of real per-capita stagnation, tipping into real decline in the latest year, within which the composition of spending is quietly shifting: central hospital services growing fastest, provincial hospitals receding, and health sciences and training cut by roughly a third in real terms, a trend that may constrain health professional training and longer-term workforce development. Per capita primary care allocations are notably equitable across provinces, but unit costs are not: near-twofold differences in cost per patient day and per PHC contact separate provinces receiving similar allocations, and nutrition is all but absent from the budget despite its documented burden.
Is the system responding? Financing is arguably the best-instrumented data domain in this paper, although, as set out below, consistency of classification has not kept pace with the quality of the instrument. Basic Accounting System (BAS) provides an annual, programme-coded account of provincial expenditure, which can be converted into comparable real-price series through deflation. Resource allocation through the provincial equitable share is informed separately by a health component that combines need and service demand: 75% is based on a risk-adjusted uninsured population, 5% on PHC visits and 20% on hospital patient-day equivalents. The relatively narrow provincial range in PHC expenditure per uninsured person is consistent with a redistributive allocation system, although the expenditure data alone cannot establish how much of this pattern is attributable to the formula or to subsequent provincial budgeting decisions.127
What prevents learning? The classification inconsistency with the implausible KZ emergency services figure and the divergent coding of community-based services show that the same money can be recorded differently in different provinces, silently corrupting comparison, a financial analogue of the reporting paradoxes noted for maternal mortality. National health-expenditure accounts do combine public, private, household and external financing sources at aggregate country level. However, no routine domestic source identified for this paper integrates provincial public expenditure, medical-scheme expenditure, household out-of-pocket payments, service use, and health outcomes in a single subnational analytical framework so the country’s most fundamental financing fact on what South Africa spends on health and on whom must be assembled manually by the reader.129 Per-capita indicators also inherit uncertainty from population and medical-scheme coverage estimates. Financial data therefore describe how much was spent and under which programme, but only partially reveal what the expenditure purchased and whether it improved equity, access, or health outcomes. |
Table 18.Health financing indicators
| Indicator |
Period |
SA |
EC |
FS |
GP |
KZ |
LP |
MP |
NC |
NW |
WC |
Expenditure per patient day equivalent (district hospitals)
BAS real 2024/25 pricesa |
2024/25 |
3 710 |
3 935 |
2 543 |
4 564 |
4 094 |
3 166 |
3 317 |
3 440 |
5 008 |
3 417 |
Medical scheme beneficiaries
both sexes all ages med schemesb |
2024 |
9 168 534 |
668 146 |
414 470 |
3 529 855 |
1 302 597 |
498 749 |
578 240 |
192 648 |
499 642 |
1 411 888 |
| female all ages med schemesb |
4 908 106 |
|
|
|
|
|
|
|
|
|
| male all ages med schemesb |
4 219 347 |
|
|
|
|
|
|
|
|
|
Medical scheme coverage
both sexes all ages med schemesb |
2024 |
14.6 |
7 |
5 |
39 |
14 |
5 |
6 |
2 |
5 |
15 |
| female all ages med schemesb |
54.0 |
|
|
|
|
|
|
|
|
|
| male all ages med schemesb |
46.0 |
|
|
|
|
|
|
|
|
|
| both sexes all ages GHSc |
2025 |
15.5 |
9.9 |
11.8 |
22.1 |
9.5 |
8.2 |
12.6 |
16.7 |
13.1 |
25.9 |
Pensioner ratio
both sexes all ages med schemesb |
2024 |
9.8 |
|
|
|
|
|
|
|
|
|
| female all ages med schemesb |
10.9 |
|
|
|
|
|
|
|
|
|
| male all ages med schemesb |
8.5 |
|
|
|
|
|
|
|
|
|
Provincial & LG District Health Services expenditure per capita (uninsured)
BAS real 2024/25 pricesa |
2024/25 |
2 408 |
2 535 |
2 320 |
2 027 |
2 509 |
2 795 |
2 541 |
2 668 |
2 283 |
2 449 |
Provincial & LG PHC expenditure per capita (uninsured)
BAS real 2024/25 pricesa |
2024/25 |
1 490 |
1 393 |
1 577 |
1 529 |
1 565 |
1 378 |
1 350 |
1 664 |
1 523 |
1 501 |
Provincial & LG PHC expenditure per
PHC headcount
BAS real 2024/25 pricesa |
2024/25 |
754 |
660 |
803 |
961 |
705 |
657 |
739 |
701 |
766 |
717 |
Total net official development assistance to medical research and basic health sectors per capita (US$), by recipient country
WHOd |
2023 |
1.2 |
|
|
|
|
|
|
|
|
|
REFERENCE NOTES
a National Treasury
b Medical Schemes 2024
c Stats SA GHS 2025
d World Health Statistics 2025
DEFINITIONS
Expenditure per patient day equivalent (district hospitals) [Rand (real prices)] — Average cost per patient per day seen in a hospital (expressed as Rand per patient day equivalent).
Medical scheme beneficiaries [Number] — Number of medical scheme beneficiaries, as reported by the Medical Schemes Council.
Medical scheme coverage [Percentage] — Proportion of population covered by medical schemes. From the 2002 GHS, Stats SA exclude missing values and unknown values from the totals used as denominators for the calculation of percentages (revised data released in 2010 with GHS 2009).
Pensioner ratio [Percentage] — Proportion of members of medical schemes who are 65 years or older, in registered medical schemes.
Provincial & LG District Health Services expenditure per capita (uninsured) [Rand (real prices)] — Provincial expenditure on District Health Services (all sub-programmes except 2.8 Coroner services) plus net local government expenditure on PHC per uninsured population.
Provincial & LG PHC expenditure per capita (uninsured) [Rand (real prices)] — Provincial expenditure on sub-programmes of DHS (2.2 - 2.7) plus net local government expenditure on PHC per uninsured population.
Provincial & LG PHC expenditure per PHC headcount [Rand (real prices)] — Provincial expenditure on sub-programmes of DHS (2.2 - 2.7) plus net local government expenditure on PHC divided by PHC headcount from DHIS.
Total current expenditure on health as percentage of gross domestic product [Percentage] — Proportion of national Gross Domestic Product that is spent on health care.
Total net official development assistance to medical research and basic health sectors per capita (US$), by recipient country [US$] — Net official development assistance disbursed to the medical research and basic health sectors of the recipient country in a year, expressed per head of population in US dollars.
Cross-domain synthesis: where is the system learning?
Read individually, the learning signals boxes assess each domain on its own terms, however, when read together, they can answer the paper’s central question comparatively: where is the raw material of learning being produced, interpreted and demonstrably acted upon? Table 19 scores each of the fourteen domains against the three arcs of the learning cycle, applying the criteria set out in the Method section: whether practice is being captured as data (coverage, quality, timeliness and disaggregation); whether data is being turned into knowledge (analysis, interpretation and published review); and whether knowledge can be shown to be changing practice (a documented response linked to the specific signal).
Table 19.Cross-domain synthesis: assessment of each domain against the three arcs of the learning cycle
| Domain |
Practice → data |
Data → knowledge |
Knowledge → practice |
| Demographic |
Established |
Established |
Partial |
| Socio-economic and environmental risk |
Partial |
Partial |
Not identified |
| Communicable diseases (excluding HIV and TB) |
Partial |
Established |
Partial |
| HIV |
Established |
Established |
Established |
| Tuberculosis |
Established |
Established |
Established |
| Maternal and reproductive health |
Established |
Established |
Established |
| Child health |
Partial |
Established |
Partial |
| NCDs |
Weak |
Partial |
Not identified |
| Nutrition |
Partial |
Partial |
Not identified |
| Injuries, violence and behavioural risk |
Weak |
Partial |
Not identified |
| Mortality and causes of death |
Established |
Established |
Partial |
| Health facilities and services |
Established |
Partial |
Partial |
| Health personnel |
Partial |
Partial |
Partial |
| Health financing |
Established |
Established |
Partial |
Source: National Treasury databases
-
Established: criterion met consistently across the domain’s core indicators
-
Partial: met for some indicators or population groups
-
Weak: largely unmet
-
Not identified: no evidence of a documented response linked to the domain’s signals was identified in the sources reviewed
Assessment criteria are described in the Method section; the assessments are the authors’ structured qualitative judgements from secondary sources and are intended to be contestable and improved upon.
The most striking pattern is that the first arc is systematically stronger than the third: South Africa is far better at converting practice into data than at demonstrating that knowledge changes practice. A complete loop, from a specific signal, through interpretation, to a documented response, can be traced in only three domains: TB, where a testing blind spot identified through surveillance was followed by the targeted universal testing policy and a measurable change in testing volumes; HIV, where the measured treatment gap gave its name to the national campaign launched to close it; and maternal and newborn health, where the confidential enquiry and audit processes feed mortality findings back into clinical practice as a matter of routine.
The weakest domains, by contrast, fail at the first arc rather than the third. NCDs lack a current prevalence denominator; injury and violence data depend on administrative systems outside the health sector; and communicable disease surveillance beyond HIV and TB, though analytically sophisticated, was destabilised by the 2024 NHLS cyberattack and remains thinly provincialised. In these domains, the question of whether knowledge changes practice cannot yet be reached, because the knowledge itself is not being reliably produced. A further pattern concerns institutional ownership: a response is most demonstrable where a single programme owns both the data and the decision, as in the disease-specific programmes, and least demonstrable where learning must cross institutional boundaries, as in the social determinants, workforce, and financing domains, where the sources reviewed for this paper identified no routine mechanism linking the data to health sector decision-making.
Limitations
This paper’s limitations follow from its design. It relies entirely on secondary data and therefore inherits every weakness of its sources, including the denominator divergence, incomplete private sector integration, and uneven disaggregation that it documents. It sits primarily on the first arc of the learning cycle: it can assess whether the raw material of learning exists, and it can identify documented responses, but it cannot determine from secondary data whether knowledge is routinely translated into practice, nor evaluate whether documented responses improved outcomes. The learning signals assessments and the cross-domain synthesis are structured qualitative judgements rather than measurements, and different assessors applying the same criteria could reach different conclusions at the margin. Reference periods differ across sources, so the picture assembled here is not a single point in time. The indicator set was closed before the release of the 2026 mid-year population estimates (P0302, July 2026) and the 2024 mortality and causes of death report (P0309, September 2026), so indicators drawing on mid-year estimates and on cause-of-death data reflect the 2025 and 2023 releases respectively, and international estimation series lag national data by up to two years in some cases, so the most recent global comparisons rest on older reference years than the national figures beside them. Several indicators important to equity, including disability, community health worker coverage, and HPV vaccinations, are measured weakly or not at all in the routine sources; their thinness in this paper reflects the state of the information system, but it is a limitation of the analysis nonetheless.
Recommendations
The recommendations below are limited to actions that follow directly from the evidence assembled in this paper. Each identifies the action required, the responsible actor and level of the health system, and the principal implementation consideration.
Establish denominator governance
The NDoH, working with Stats SA, should issue and maintain an annual denominator concordance for routine health indicators, specifying which population series underpins each published rate, how the Census 2022 rebasing will be managed across time series, and which series provincial and district planners should use. This is a national action with mandatory adoption in provincial and district planning. It can be attached to the annual DHIS indicator definitions release at minimal cost; the binding constraint is assigning clear institutional ownership.
Protect the machinery of the second 95
The NDoH and provincial treasuries should ring-fence domestic replacement funding for the community-based testing, linkage, retention, and data-capture functions previously supported by PEPFAR, prioritising the provinces with the lowest ART coverage identified in this paper. The funding decision is national; implementation is provincial and district. The published modelling of the consequences of withdrawal provides the investment case, and monitoring should track the second 95 and effective coverage, the indicators this paper shows to be most sensitive to the gap.
Rebase the NCD denominator
The NDoH, with the SAMRC and research funders, should commission a national health examination survey to replace SANHANES-era prevalence estimates for diabetes, hypertension and related risk factors, without which the 90-60-50 cascade cannot be monitored. This is a national action. The survey should be designed to provide provincial estimates and planned as a repeating series rather than a single study, because a cascade requires a current denominator on a continuing basis.
Mandate a minimum private sector indicator set
The CMS, with the NDoH, should define a minimum set of indicators that medical scheme administrators report in units compatible with public sector definitions, beginning with births, caesarean sections, immunisation doses, and bed utilisation, so that national estimates no longer require the manual linkage performed for this paper. This is a national regulatory action achievable through existing CMS reporting powers; definitions can be aligned with existing NIDS indicator definitions, and the obstacle is the absence of a mandate rather than of technique.
Institutionalise pre-publication data quality screening
Provincial health information units should institutionalise outlier and plausibility screening of DHIS data, of the kind that identified the Free State bed-count error in this paper, with district-level verification of flagged values before indicators are released. This is a provincial and district action. Screening rules based on internal consistency, year-on-year change thresholds, and facility-size plausibility are simple to automate within the existing webDHIS platform; the requirement is a defined workflow with accountability for sign-off.
A research agenda
The gap this paper cannot close, whether knowledge changes practice, is itself the priority research agenda arising from it. This includes studies of how routine health information is actually used in district and provincial decision-making; investigation of why provinces with comparable resources achieve different outcomes, treating variation as a question rather than a verdict; and evaluations that follow documented responses, such as the measles catch-up campaign and the treatment-gap campaign, through to measured outcomes. These questions align with the AHPSR framing of learning as a capability that must be deliberately built and governed,5 and could be institutionalised as a standing evaluation function within the national health information system.
Conclusion
The indicators presented in this paper tell a story of a health system that is not standing still. South Africa has rebuilt important health gains after major shocks, sustained one of the world’s largest HIV responses, strengthened elements of TB surveillance and adaptation, and institutionalised parts of the feedback architecture needed for maternal, newborn and child health improvement. These achievements matter. In the domains where a complete feedback loop can be demonstrated, most clearly TB and the maternal and perinatal audit systems, they show that when data are visible, trusted, routinely reviewed and connected to action, the system can learn. In most other domains, the evidence assembled here establishes data availability, and in some cases a documented response, but not yet demonstrated learning.
Yet this paper also shows that learning remains uneven. Across domains, the same pattern recurs where national averages obscure deep provincial variation; indicators are often available too late or at too high a level to guide local response; denominator differences can alter interpretation; and major burdens, particularly NCD, injuries, environmental risks and private sector service use, are still not measured with the completeness required for confident decision-making. The result is a system with substantial knowledge, but too many weak links between knowledge and practice.
The central lesson is that South Africa’s next health gains will depend less on the existence of data than on the discipline of using it. An LHS requires more than dashboards, reports and annual tables. It requires a culture in which variation is treated as a prompt for enquiry rather than as a static description; where better-performing provinces and districts are studied for transferable practice; where poor performance triggers support and accountability; and where every policy or programme change is followed by measurement of whether it worked. In such a system, the question is not only “what does the data show?” but “what will we do differently because of it?”
Several priorities follow from this analysis. Denominator governance must be strengthened so that users understand which population series underpins each rate and how revisions affect trends. Routine public sector data should be joined more deliberately with survey, surveillance, mortality, financial, workforce, environmental and private sector data. Sub-national disaggregation needs to become standard practice, because national progress is meaningful only when it can be seen in provinces, districts and the communities most at risk of being left behind. Data systems should also be judged not only by completeness, but by whether they shorten the distance between signal and response.
Ultimately, the value of this paper lies not in the indicators themselves, but in the learning they make possible. The data show where South Africa is improving, where inequities persist, where the system is under strain, and where silence in the data is itself a warning. If these signals are used only for reporting, they will describe the system without changing it. If they are used to guide decisions, test responses, compare practice and hold the system accountable for learning, they can become the foundation for better care and fairer outcomes.
The task ahead is therefore twofold: to become more responsive to what existing data already reveal, and, at the same time, to close the gaps in data availability, quality, integration and disaggregation that this paper documents, since a system cannot respond to signals it cannot see.
South Africa’s health system holds substantial data assets, sufficient in many domains to see the path forward, even as important information and surveillance gaps remain. The challenge now is to build the habit, capacity, and accountability to follow it. That is the promise of an LHS: not a system that knows everything, but one that learns faster, acts sooner, and improves deliberately. The indicators in this paper are not the end of the story, they are the invitation to change it.
Acknowledgements
We gratefully acknowledge Ms Ntombifuthi Blose and Mr Emanuel Dominic for their contribution to the data curation for this paper. We also thank the National Department of Health and the National Treasury for providing access to the data used in the compilation of the indicators.
Abbreviations
| Abbreviation |
Description |
| AHPSR |
Alliance for Health Policy and Systems Research |
| ALOS |
average length of stay |
| AMR |
antimicrobial resistance |
| ART |
antiretroviral therapy |
| BAS |
Basic Accounting System |
| Child PIP |
Child Healthcare Problem Identification Programme |
| CHW |
community health worker |
| CMS |
Council for Medical Schemes |
| DHIS |
District Health Information System |
| EC |
Eastern Cape |
| EDRWeb |
Electronic Drug-Resistant Tuberculosis Register |
| EMS |
emergency medical services |
| EPI |
Expanded Programme on Immunisation |
| ESBL |
extended-spectrum beta-lactamase |
| FS |
Free State |
| GBD |
global burden of disease |
| GERMS-SA |
Group for Enteric, Respiratory and Meningeal Disease Surveillance in South Africa |
| GHS |
General Household Survey |
| GP |
general practitioner; Gauteng |
| HIV |
human immunodeficiency virus |
| HPV |
human papillomavirus |
| IMD |
invasive meningococcal disease |
| iMMR |
in-facility maternal mortality ratio |
| KZ |
KwaZulu-Natal |
| LHS |
learning health system |
| LMIC |
low- and middle-income countries |
| LP |
Limpopo |
| MDR-TB |
multidrug-resistant tuberculosis |
| MP |
Mpumalanga |
| NC |
Northern Cape |
| NCCEMD |
National Committee on Confidential Enquiries into Maternal Deaths |
| NCD |
non-communicable disease |
| NDoH |
National Department of Health |
| NFNSS |
National Food and Nutrition Security Survey |
| NHLS |
National Health Laboratory Service |
| NICD |
National Institute for Communicable Diseases |
| NMCSS |
National Notifiable Medical Conditions Surveillance System |
| NW |
North West |
| PEPFAR |
United States President's Emergency Plan for AIDS Relief |
| PERSAL |
Personnel Administration System |
| PHC |
primary health care |
| PLHIV |
people living with HIV |
| PPIP |
Perinatal Problem Identification Programme |
| PrEP |
pre-exposure prophylaxis |
| RSV |
respiratory syncytial virus |
| RTMC |
Road Traffic Management Corporation |
| SACENDU |
South African Community Epidemiology Network on Drug Use |
| SAHR |
South African Health Review |
| SAM |
severe acute malnutrition |
| SAMRC |
South African Medical Research Council |
| SANAC |
South African National AIDS Council |
| SANC |
South African Nursing Council |
| SANHANES |
South African National Health and Nutrition Examination Survey |
| SAPC |
South African Pharmacy Council |
| Stats SA |
Statistics South Africa |
| STI |
sexually transmitted infection |
| TB |
tuberculosis |
| THEMBISA |
THEMBISA HIV and AIDS model |
| VMMC |
voluntary medical male circumcision |
| WC |
Western Cape |
| webDHIS |
Web-based District Health Information System |
| WHO |
World Health Organization |
| XDR-TB |
extensively drug-resistant tuberculosis |